Constructing Missing Crime Tables
Here I take the raw data from the National Crime Victimization Surveys and construct summary results missing from recent reports.
Introduction
The National Crime Victimization Survey is the primary source of information on criminal victimization in the United States. The survey is large and nationally representative, and each year the Bureau of Justice Statistics publishes a report summarizing the results, e.g., “Criminal Victimization, 2018.”
On Twitter not too long ago, I saw people complaining that information present in earlier reports — especially related to the offender demographics in incidents with Asian victims — was no longer included in the most recent reports. Why not simply calculate the missing information myself? After all, the data sets are public.
A relevant table from the earlier report can be seen below. It shows the offender’s race/ethnicity as reported by the people in the survey who had been victims of a violent crime:
For example, it is estimated from the survey that, for violent incidents with Asian victims in 2018, the offender was white in 24.1% of cases.
The report from the following year has a similar table, just stated in terms of estimated number of crimes rather than as percentages (see below). But note that Asian as a category is missing in the table. And in the year following that, in “Criminal Victimization, 2020”, the table did not even exist. In the most recent report, the table is included again, but Asian as a category remains left out. I think there are plausible innocent reasons for leaving them out1, but I still think it is worth showing.
Missing tables revealed
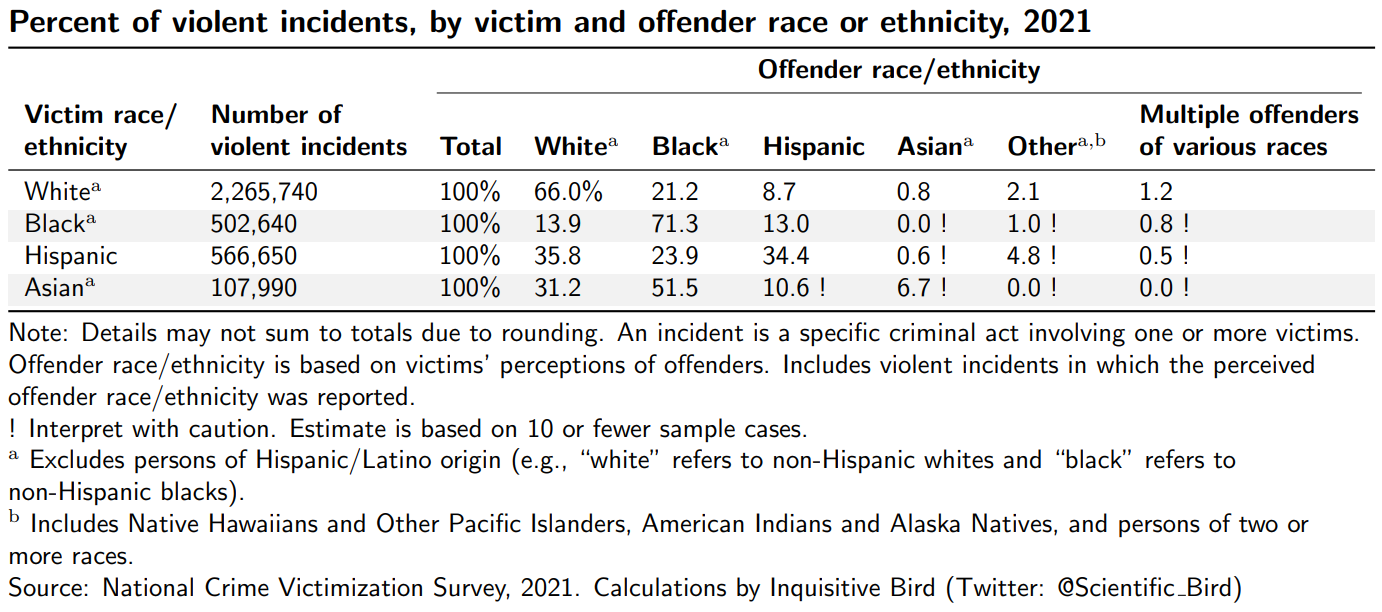
I downloaded and prepared the relevant data and did the data analysis necessary to create the tables. The results are shown below.
First for 2019:
Next for 2020:
Lastly for 2021:
Those are the three tables which were either fully missing or where Asians as a group were missing. Some caution is necessary when interpreting the results, as the estimates especially for Asians are often based on few sample cases. With that said, a change does seem to have occurred from 2019 to 2021, not least in the fact that the estimated total number of violent incidents experienced by Asians in 2021 was greater than the two preceding years (but not as high as in 2018).
Given the statistical uncertainty in some of these estimates, I decided to aggregate the data from the four years 2018, 2019, 2020, and 2021. That results in the following table:
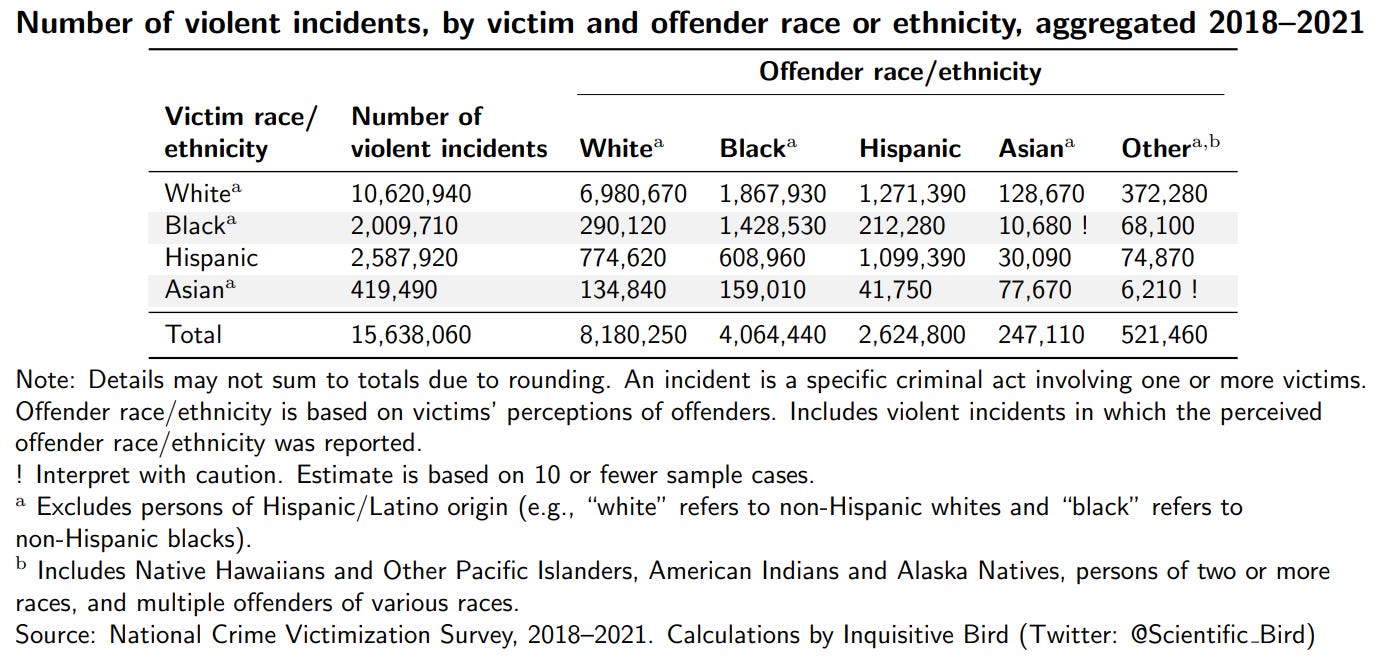
For completeness, I also include a table with estimated number of incidents in each group, again aggregated across the years 2018–2021:
And now with updated data for 2018–2022:
In the United States, Asian-Americans are the smallest of the four groups analyzed (Asians, Whites, Blacks, and Hispanics). Combining that with the relatively low rate of violent crime in the Asian community, there are far fewer cases in the survey to base the national incident estimates on than there are for the other three groups. This makes the estimates more uncertain.


There is some really interesting stuff here. I put it in excel and converted the % to actual incidents. From what I can see it looks like during that time Blacks and Hispanics attacked more white people than victims of their own race. 1.9mm black on white attacks but only 1.4mm Black on Black attacks; 1.27m Hispanic on White attacks but 1.1mm Hispanic on Hispanic attacks. White on black was 289k incidents. Considering there are 200 million Whites and about 40 million Blacks the disproportion is pretty astounding. Do you mind if I write about that and link to this page? Am I reading that wrong?
I get that, and I appreciate this entire project. If I wanted to learn statistics of the type you do, theoretically and practically, what would you recommend doing?