The Effects of Immigration in Denmark
First, I briefly summarize statistics on the fiscal impact of immigration in Denmark, taken from an official government report. Second, I add my own analysis on violent crime conviction rates by nation of origin. Together they give a more complete overview of immigration in Denmark.
Net Financial Contribution of Immigrants in Denmark
Not all countries have formal population registers. However, Scandinavian countries in particular are well-regarded in this respect, having government databases storing comprehensive and high-quality data of the full populations. Denmark is especially interesting because it is the only Scandinavian country to have properly quantified the net fiscal impact of immigration based on register data. This analysis has been conducted and described in the official Danish government report, Immigrants’ net contribution to the public finances in 2018. The net financial contribution of a person is conceptually simple: their total contribution to the state finances, subtracted their total costs.
The report finds that the total net contribution in 2018 by native Danish people was +41 billion DKK. The contribution of immigrants and their descendants was net negative at -24 billion DKK (Table b). However, net contribution was highly heterogenous by group as will be illustrated in the following figures. The figures are taken directly from the report, with the minor tweak that I have translated the text to English. The first figure included here (Figure 2.7) shows the average net financial contribution at all ages by broad nation category: Danish origin, Western countries, MENAPT (Middle East, North Africa, Pakistan and Turkey), and other non-Western countries.1
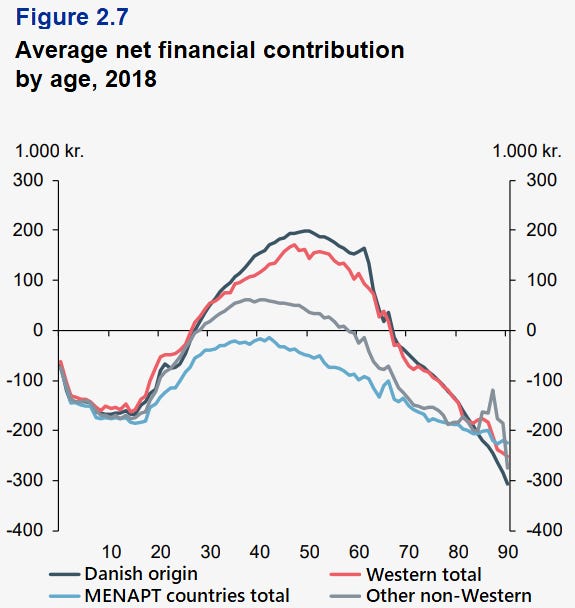
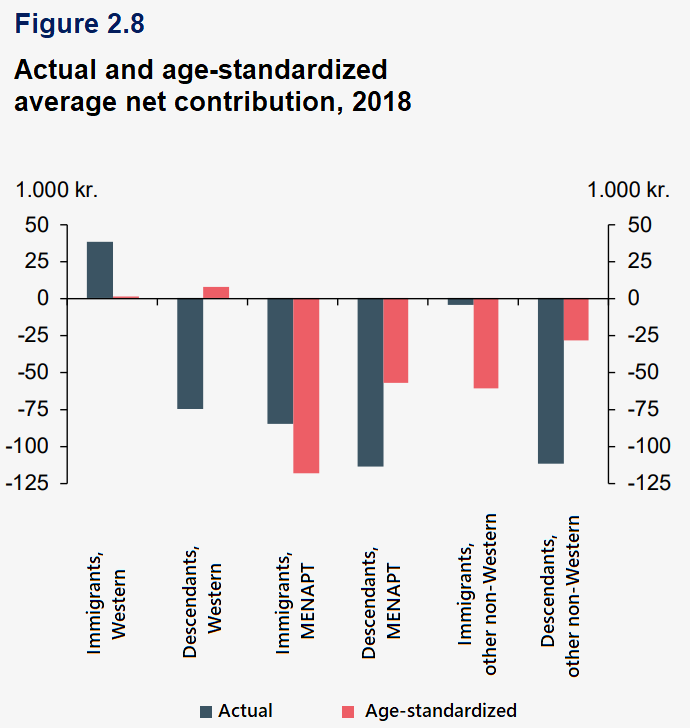
As is expected, children and the elderly are net negative contributors. To compensate for this net cost, it is necessary and expected that people in their prime working age have a sufficiently large net positive contribution. The next Figure (2.8) shows what the total net contributions are. On the whole, they find that Western immigrants (and their descendants, i.e., 2nd generation immigrants) have a small positive net financial contribution, whereas MENAPT and other non-Western immigrants and descendants have a net negative financial contribution.
Given the strong relationship between age and financial contribution, the analysis also considers age-adjusted figures. The next figure shows the actual net contributions as well as the age-standardized net contributions of immigrants and their descendants. Adjusting for age substantially changes the estimates of net contribution. This is because immigrants and natives differ in their age composition, with immigrants being disproportionately young adults.
Lastly, the report also provides net financial contribution by immigrants of specific country of origin, which can be seen below. The list includes all countries of origin with at least 5,000 individuals in Denmark.
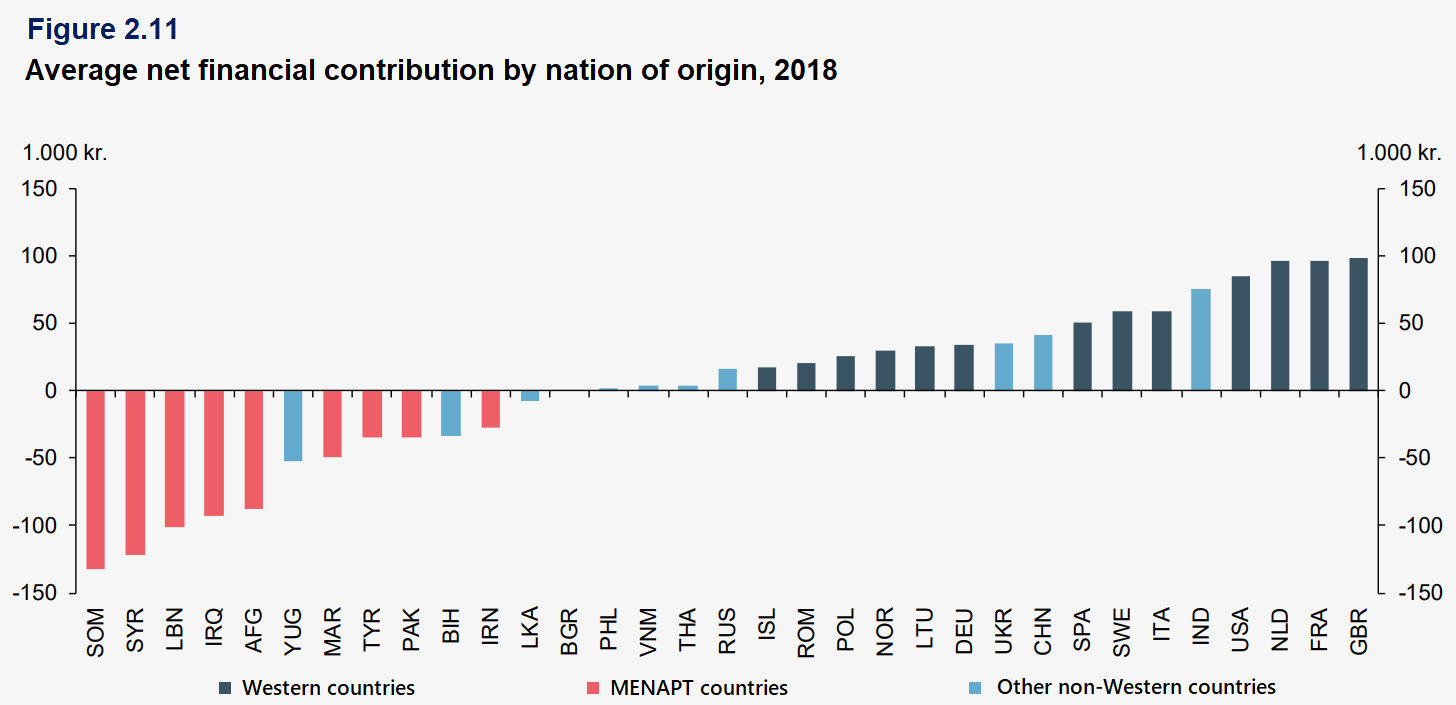
In general, net contributions are positive for Western countries and negative for MENAPT countries. For other non-Western countries, some have positive contribution and some negative. Unfortunately these nation-of-origin estimates are not adjusted for age. With that said, we know that adjusting for age would systematically lower these estimates (as demonstrated in Figure 2.8). Thus once adjusted for age, immigrants from Western countries, instead of being net positive in all cases, would probably be roughly evenly distributed below and above zero (the aggregate estimate is just barely above zero in Figure 2.8). MENAPT countries would go further into the negatives after age adjustments.
Violent Crime Convictions
Having summarized the results of the official government financial analysis, I now append with my own analysis on the topic of immigration and crime. An official Danish report is available to be read, however it is written in Danish and is less comprehensive than my analysis in some aspects2. According to Danmarks Statistik, there were 5,921 violent crime convictions in 2021, of which 71% (4,193) were committed by people of Danish origin and 29% (1,728) by immigrants and their descendants. In 2021, immigrants and their descendants represented 14% (817,438) and people of Danish origin 86% (5,022,607) of the total population of 5,840,045. Thus immigrants and descendants are overrepresented in violent crime convictions, being 14% of the population and constituting 29% of the violent crime convictions. This translates into immigrants and descendants having 2.5 times higher conviction rates than natives.
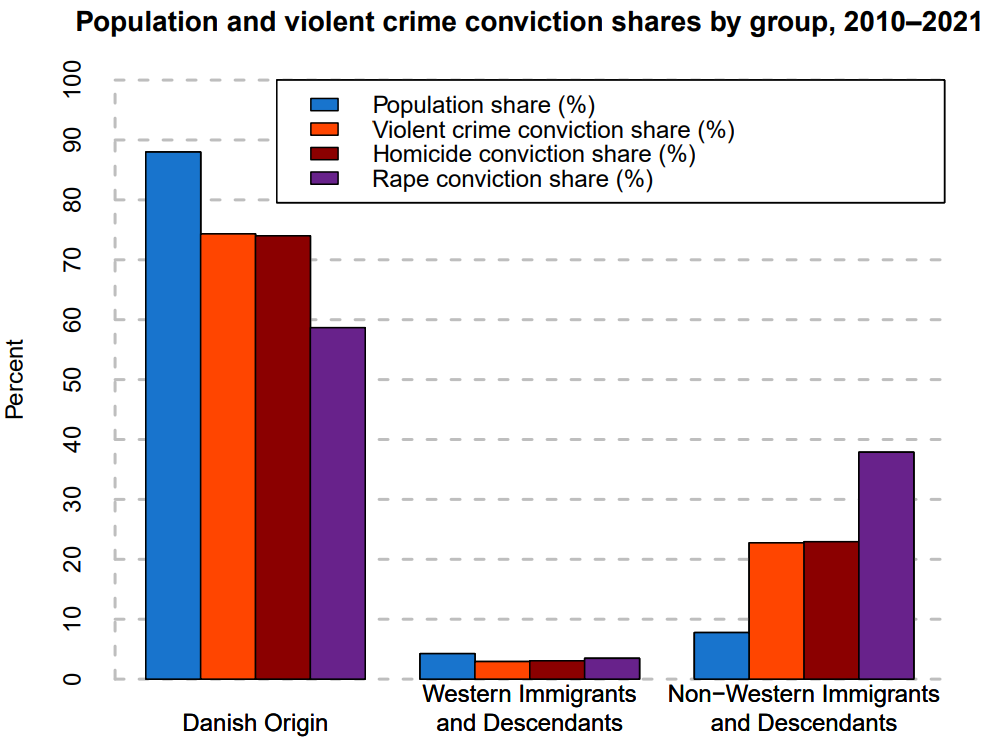
However, like financial contributions, convictions also exhibit great heterogeneity. Western immigrants and descendants were 5.0% of the population and accounted for just 3.8% of the nation’s violent crime convictions. Non-Western immigrants and descendants were 8.9% of the population and accounted for 25.4% of the nation’s violent crime convictions. Homicide is very uncommon in Denmark, but we see a similar pattern for homicide convictions. For rape convictions, the pattern is even stronger. The results for the period 2010-2021 can be seen in the figure below. For each group, it shows the population share and the share of total violent crime convictions, as well as shares of specific types of violent crime convictions, that can be attributed to each group.
We can also convert these to conviction rates relative to that of natives. This can be seen in the figure below.
Overall, Western immigrants have violent conviction rates that are approximately 20% lower than that of natives, whereas Non-Western immigrants have approximately 3.5 times higher conviction rates than natives.
The heterogeneity can be analyzed at an even finer granularity. The Danish government agency Danmarks Statistik publicize the data necessary to compute the conviction rates by country of origin.3 The figure below shows the results for the years 2010–2021 expressed in terms of multiples of the Danish rate.
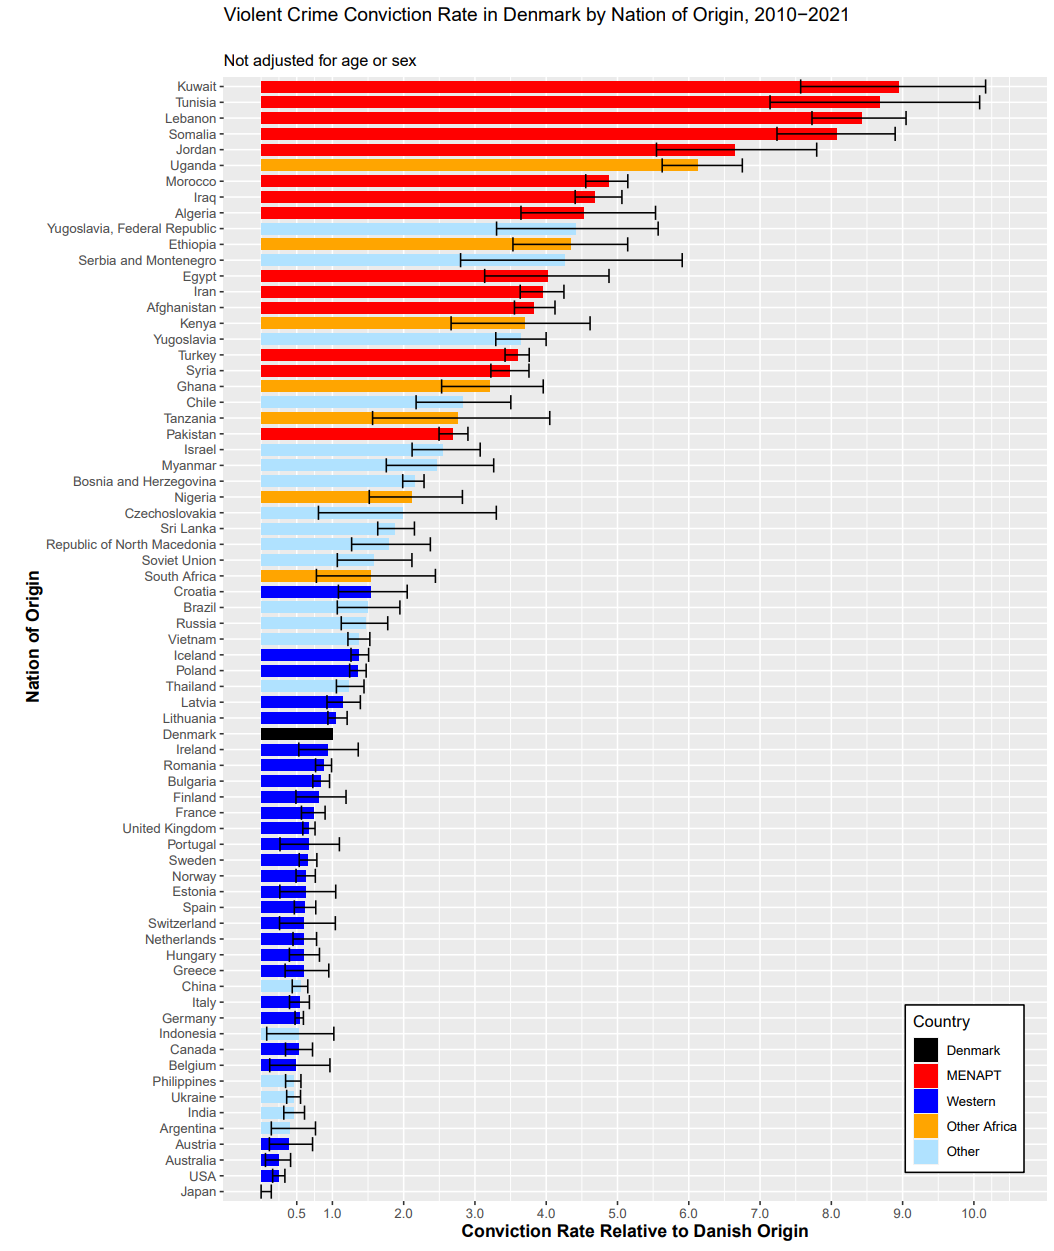
At the bottom we see that several immigrant groups have conviction rates less than half of that of natives (Japanese immigrants manage to have zero violent convictions in this 12 year period). At the top, we see some groups having conviction rates >8 times higher than natives. However, none of the figures in this section are adjusted for age, which is a potential major contributor to the observed disparities. We will consider that now.
Accounting for age and sex
Crime rates vary greatly with age and sex. The rate of imprisonment for violent crimes in Denmark (averaged across 2010–2021) by age and sex is illustrated below. It goes without saying that violent conviction rates are highest in young males. Violent crime rates seem to peak in the late teens. At least in this data, the female peak (age 16) is earlier than the male peak (age 19), possibly reflecting the earlier female puberty (peak years marked with dashed lines).

Further, the age composition of immigrants differs substantially from the native population (see below). Immigrants cluster disproportionately at ages with higher rates of violent criminality. For this reason, age is arguably the first and most crucial variable to consider when observing any disparities between immigrants and natives. The sex ratio of immigrants also occasionally deviates nontrivially from a typical approximate half/half balance. This is usually not as severe an issue in practice, but still good to account for sex ratio when possible.
Violent conviction rates adjusted for age and sex
We can account for differences in age and sex distributions the following way. Instead of simply dividing by the total amount of people from each nation of origin, we can scale people counts by the age/sex violent crime conviction curves displayed in the previous section. For example, ten men of the age of 30 would create a far larger denominator than ten women of the age of 60. The results adjusted for age and sex can be seen below.
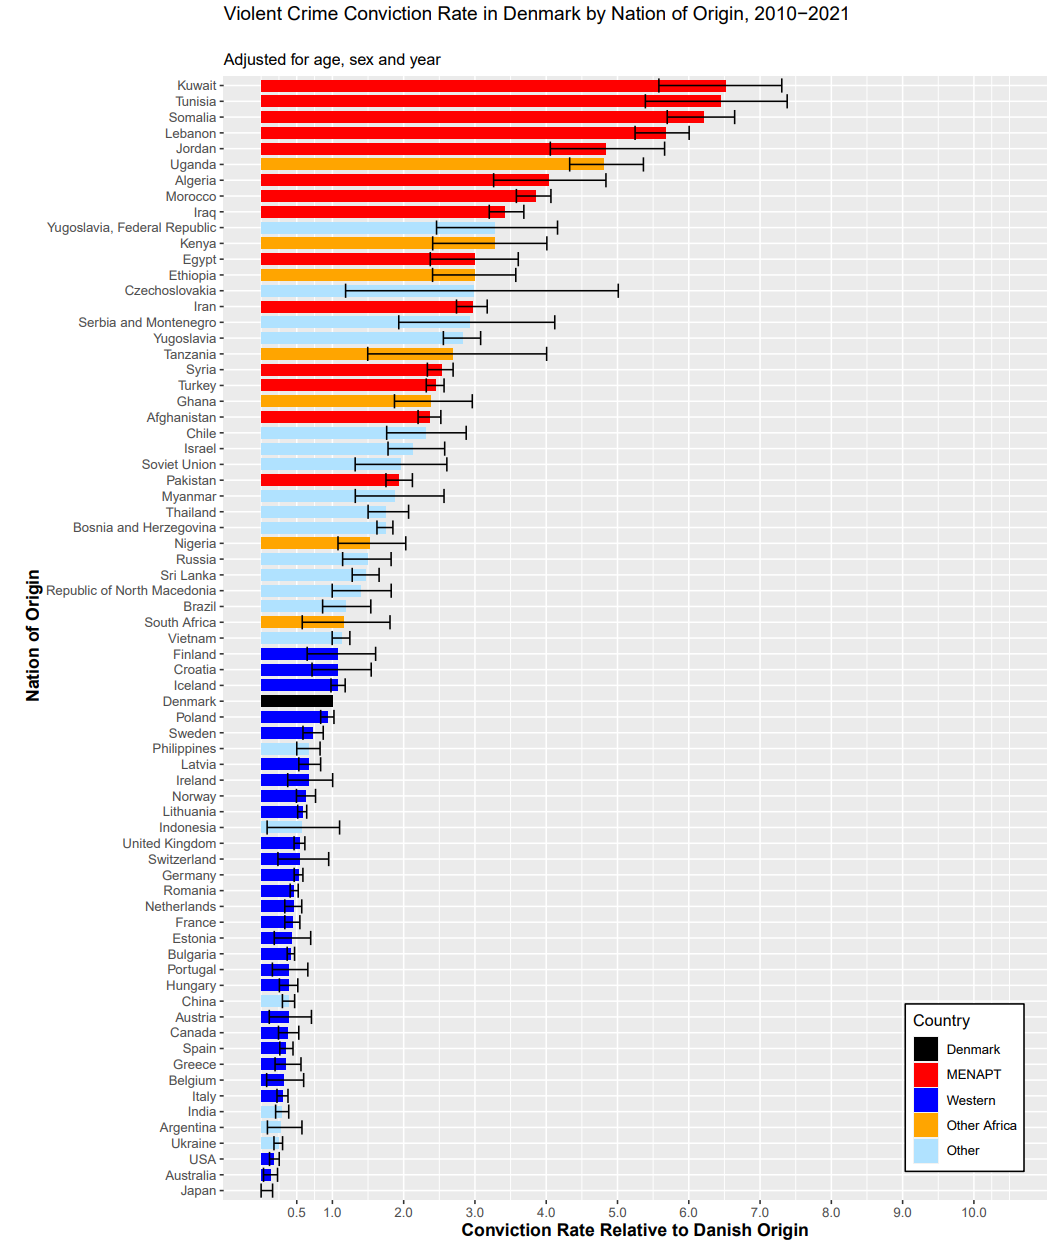
A few facts are evident. First, adjusting for age and sex has very little influence on the nations’ rank order. Those that were previously near the top continue to be so, and vice versa. However, I find that, on average, the rate ratios are reduced by 20-25% when accounting for age, sex and year. This is almost exclusively because of the age differences between natives and immigrants.
Second, it remains the case that the disparities are largely unexplained by differences in age or sex compositions. The top immigrant groups have >6 times greater conviction rates than natives, even when age and sex compositions have been adjusted for (down from >8 in the unadjusted model).
To finish, a few things are worth considering. First, I have analyzed violent crime convictions. The extent to which convictions systematically deviate from actual criminal behavior I cannot say. Second, except for considering age and sex compositions, I have not attempted to explain the causes of the observed disparities. This is a difficult task, and perhaps worth revisiting at a later time, but I am not sure if I could do such an analysis justice with the available data. The official Danish report, with results highly consistent with that of my analysis, go further in attempting to explain the disparities. Along with age composition, they also control for various familial socioeconomic indicators. While such controls attenuate some disparities somewhat, they conclude that “the overall picture doesn’t change,” writing: “people from non-Western countries have higher [crime] index than people from Western countries, which cannot be explained by age, socioeconomic status, the family’s educational level or the family’s income.”4
The categorization used in the official Danish government report is the following. “Western” countries are all countries in the European Union, Andorra, Australia, Canada, Iceland, Liechtenstein, Monaco, New Zealand, Norway, San Marino, Switzerland, United Kingdom, USA and the Vatican. “MENAPT” countries are Kuwait, Tunisia, Somalia, Lebanon, Jordan, Algeria, Morocco, Iraq, Iran, Egypt, Syria, Turkey, Afghanistan, Djibouti, Libya, Mauritania, Oman, Yemen, Pakistan, Saudi Arabia, Qatar, Sudan, Bahrain, United Arab Emirates.
The official report is based on a single year’s data, whereas my analysis aggregates data of multiple years for greater reliability. My analysis also focuses entirely on violent crime, whereas the official report focuses mainly (but not entirely) on overall crime. The report also only gives nation-of-origin estimates for the 30 or 15 (depending on analysis) nations with largest populations in Denmark. My analysis provides estimates for all nations for which there is data available; something I can do because of the greater reliability as a result of aggregating across multiple years.
Data was retrieved from Statistikbanken. To calculate the rate, you need the following: (1) the total number of convictions for violent crimes by country of origin, (2) and the total number of people by country of origin. The conviction rate is simple the former divided by the latter. The necessary datasets are as follows. STRAFNA4: Persons guilty in crimes aged 15-79 years by type of offence and country of origin (2000-2021). FOLK2: Population 1. January by sex, age, ancestry, country of origin and citizenship (1980-2023).
Caution should also be taken when interpreting results that control for socioeconomic factors. Unlike age and sex, socioeconomic outcomes are affected by personal behavior. Since common causes likely contribute to both socioeconomic outcomes and criminal outcomes, adjusting for socioeconomic factors can “overcontrol,” removing more than just what is caused by the socioeconomic differences themselves.


Whenever people try to argue immigrants aren't a net cost they usually use these tricks:
1) Disproportionally count prime age working years. Pretend they never one day need a pension or have to have their kids educated.
2) Call the descendants of immigrants natives (as a technical question of citizenship in a birthright citizenship country this is true, but we all know its trying to hide the ball).
3) Mix high end immigrant groups in with low end immigrant groups, when we all know its the low end immigrant groups people are worried about.
4) Only count the most direct costs. Ignore things like that they pay $X towards education expense when the state spends $Y educating their children where $Y > $X.
The most obvious answer is that the performance of any immigrant group will probably resemble the performance of natives with similar average IQ. If your way off from that, somebody is playing with the numbers.
Water is wet.