
The rise of life expectancy
Illustrated and explained

Introduction
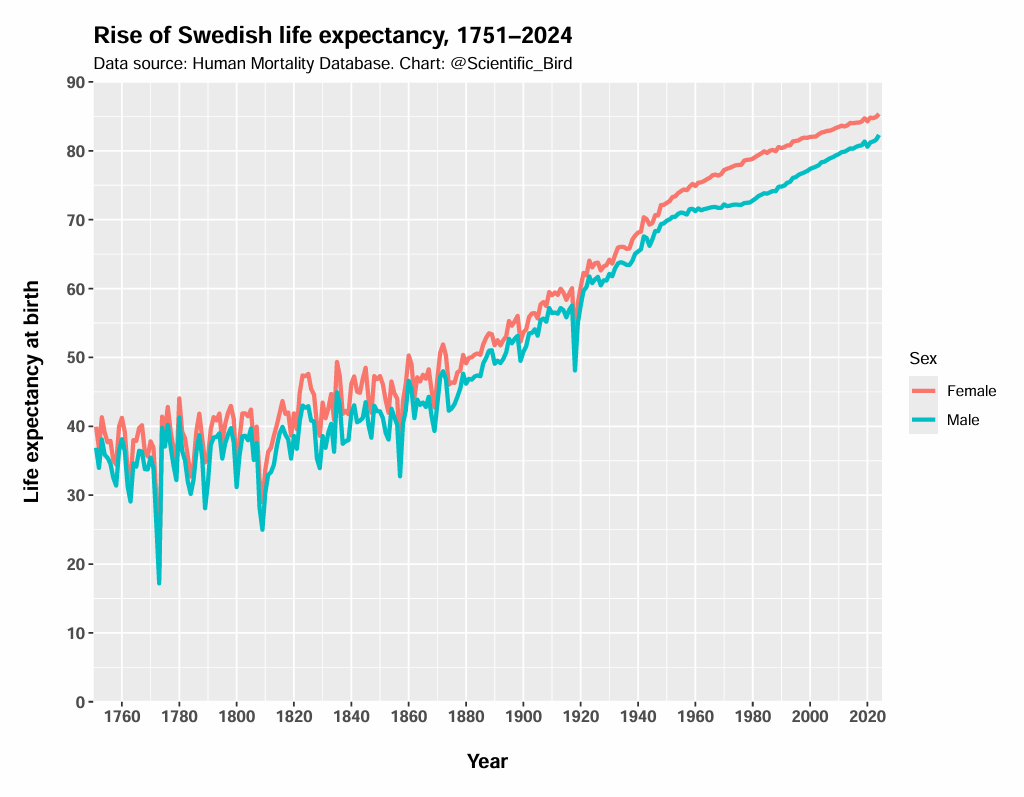
Life expectancy has dramatically increased across the West. In Sweden1, life expectancy at birth was 30-some years in the 18th century, and today it’s above 80 years. A Swedish person, on average, lives half a century longer today.
Though widely acknowledged, there are two opposing pitfalls of interpretation that people often fall into.
The first camp believes that, since life expectancy used to be 30-some years, people fell dead when they reached their thirties. According to this camp, it would be historically unusual to see a 70-year-old person. This is wrong. Even the Bible tells us, “The days of our years are threescore years and ten.”
The second camp rightly points out that life expectancy is an average that is greatly dragged down by infant mortality. They then go further and argue that if a person survives infancy (or perhaps young childhood), life expectancy has remained largely unchanged. But this is a major over-correction.
Yes, the infant mortality rate has dramatically declined. But the reality is that mortality rates have dramatically declined—at all ages. While it wouldn’t be unusual to see a 70-year-old in the past, the majority did not survive to that age, even among those who escaped the deadly first few years. Today, it is more unusual to not survive to age 70.
In this piece, I will systematically analyze the nature and extent of the rise of life expectancy.
A glance at history
People have never lived as long as they do today. Despite idealistic notions about the simple past, hunter-gatherers lived substantially shorter lives than us. This is not to say that people never grew old, it was just much less common.
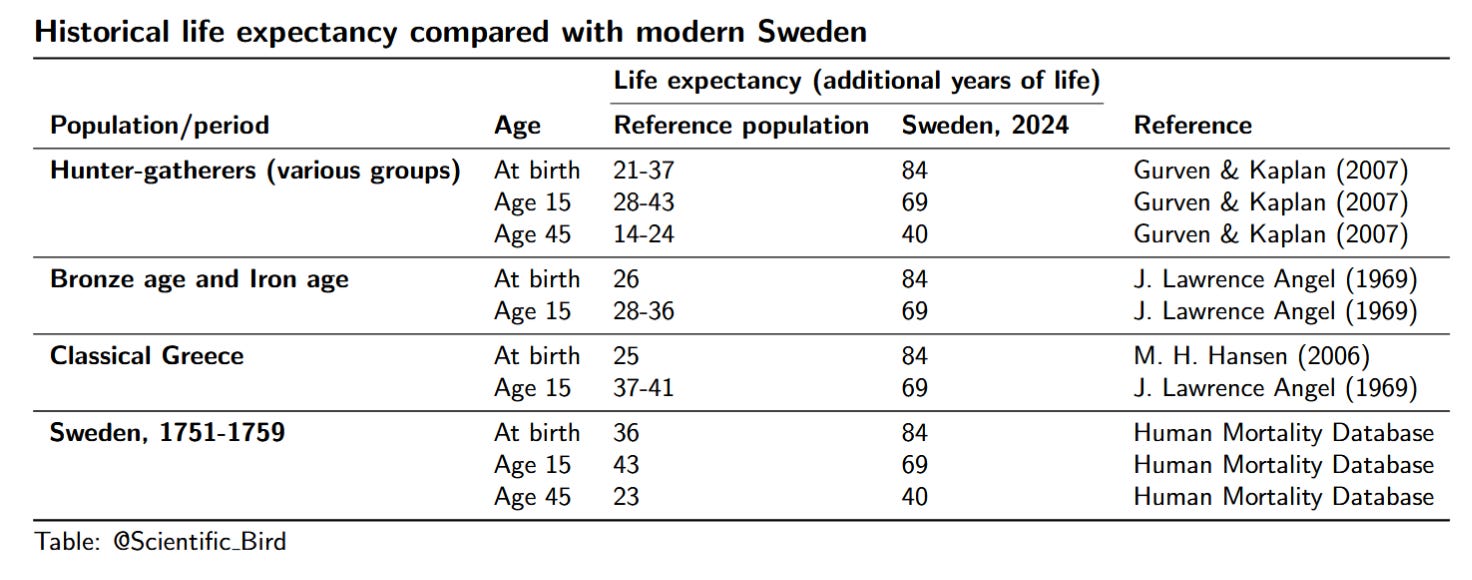
In a cross-cultural review, Gurven & Kaplan (2007) analyze longevity data among several hunter-gatherer societies. The average life expectancy at birth ranged from 21 to 37 years, compared to 84 in modern Sweden. Much of this is certainly driven by infant mortality; however, even those who lived to age 45 were not expected to live to age 70—much lower than life expectancy at birth in modern Sweden. More precisely, the (additional) life expectancy at age 45 varied from 14 to 24 years, compared to 40 in today’s Sweden.
True prehistoric times may have been even worse. Trinkaus (2011) analyzed Late Pleistocene specimens of human remains for which age could reliably be assessed. The results confirm a dearth of older adults, consistent with short life expectancy.
Below is a table of life expectancy estimates for various periods or populations, compared with the Swedish 2024 equivalent. What’s clear is that modern Swedes not only have much higher life expectancy at birth, but also much higher life expectancy conditional on surviving past infancy and childhood.
Individuals in history
As someone interested in the history of mathematics, I often read biographies of notable mathematicians in history. In doing that, it’s difficult to not take note of early deaths. While many notable historical figures lived to the 70s, and some even to the 80s, it is striking how many died in the early-60s, 50s, 40s, and sometimes even younger. John Graunt (1620-1674), often regarded as the founder of demography, and who analyzed mortality data, himself died at 53.
Did any live very long lives? Certainly. Isaac Newton (1643-1727) lived to an impressive age of 84. The polymath Christopher Wren (1632-1723) died at 90. I was amazed to discover that the Danish 16th century mathematician Thomas Fincke (1561-1656) died at 95 years of age.
These cases are exceptional, however. Many of the great mathematicians of history died before their 50s. Bonaventura Cavalieri (1598-1647) and Evangelista Torricelli (1608-1647), both very important figures in the development of calculus, died at 49 and 39, respectively. Blaise Pascal (1623-1662) died of disease when he was 39 years old.
Young deaths remain relatively common well into the 19th century. Arguably Norway's greatest mathematician ever, Niels Abel (1802–1829), died of tuberculosis when he was just 26 years old. Bernhard Riemann (1826-1866), one of the greatest mathematicians of all time, died at 39 of the same cause. Even Frank Ramsey (1903-1930) died as a 26-year-old, possibly due to an infection caught while swimming. Lastly, it would be remiss of me not to mention Évariste Galois (1811-1832), who famously died at just 20 years old. Though he died in a duel—not the usual public health matter.
The point is not to suggest that these young deaths represent the norm, but rather that dying as a young adult was a very real concern. These are all major figures in the history of mathematics; it’s not like I had to dig deep to find obscure examples of mathematicians who died young. And, of course, many people in history would have made important advances and become notable had they lived longer lives.
The conclusion is clear. Even if you survived young childhood, you were by no means guaranteed a long life. The next sections are devoted to illustrating this in a systematic manner.
Data analysis
In the following sections I will document the rise of life expectancy, visualizing it from multiple perspectives. Owing to its long time series, I will focus on data from Sweden. The establishment of Tabellverket in 1749 gave Sweden a head start with population statistics (Sköld, 2004).
I will also focus primarily on females to minimize the effects of violent deaths (less relevant from a public health standpoint). With that said, the broad trends uncovered here will apply to both sexes and to other Western countries, even if they would differ slightly in detail.
1 — Conditional Life Expectancy
To show that the rise of life expectancy isn’t merely a matter of infant mortality, we can simply track life expectancy for people who live beyond infancy. Below I show that, conditional on reaching age 15, the life expectancy has nevertheless massively grown.
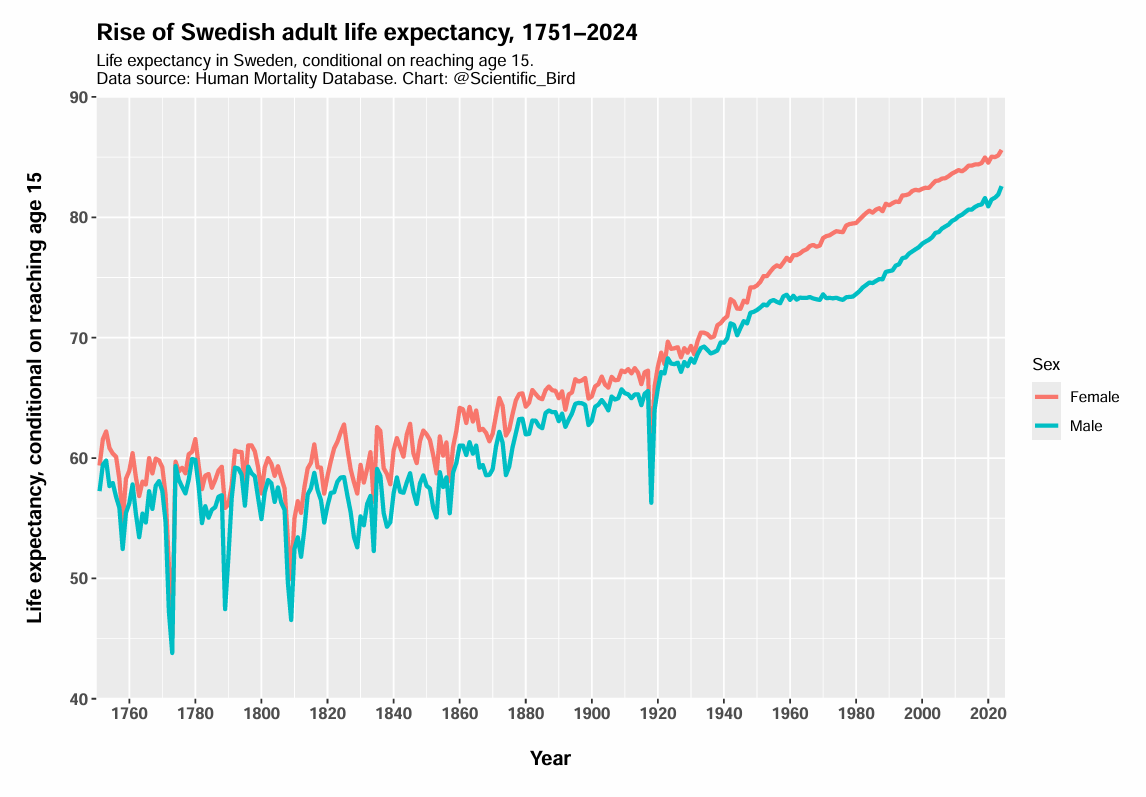
As the figure shows, even when restricted to the subset of people who live to age 15, life expectancy has increased by a staggering ~26 years.
Though I focus on Sweden due to its long time series, it’s helpful to illustrate other countries at least once to verify that Sweden is not some exceptional outlier. Using all countries where data is available since before 1900 (in the Human Mortality Database), I have illustrated life expectancy conditional on reaching age 15 below.
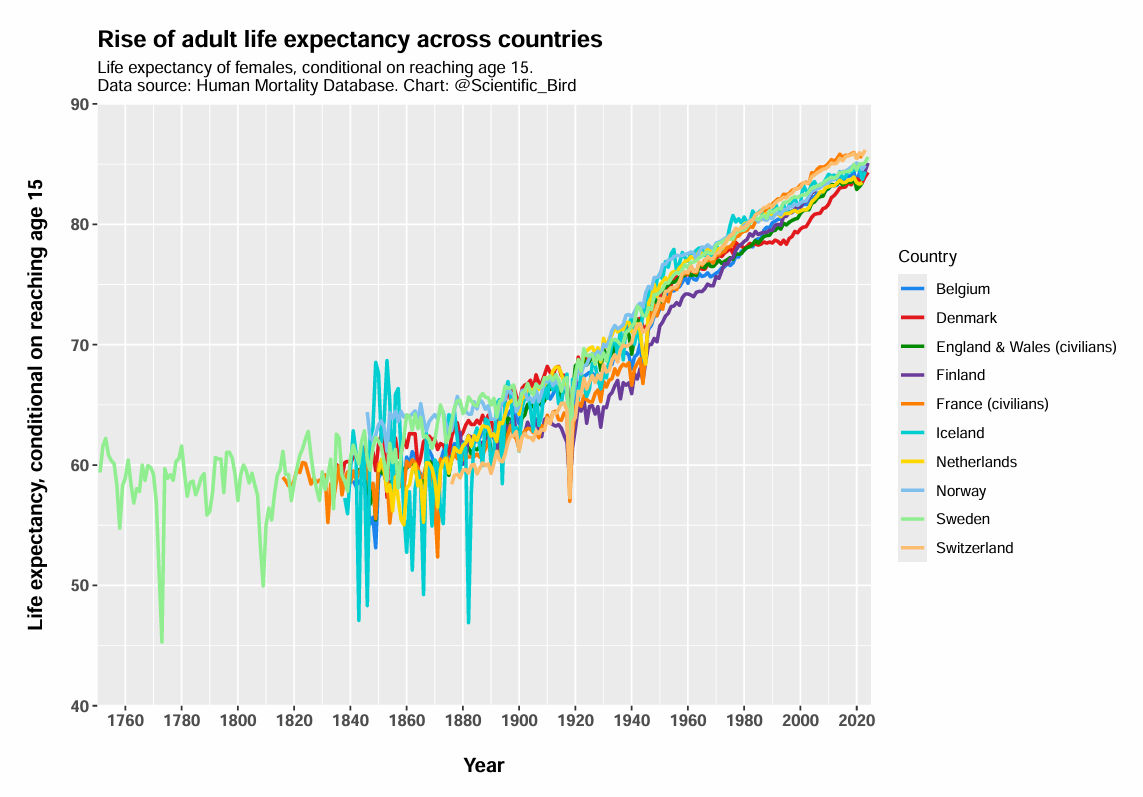
In the 19th century, across these countries, a 15-year-old female on average lived to approximately age 59. In 2024, the life expectancy is 85 years, or 26 years higher.
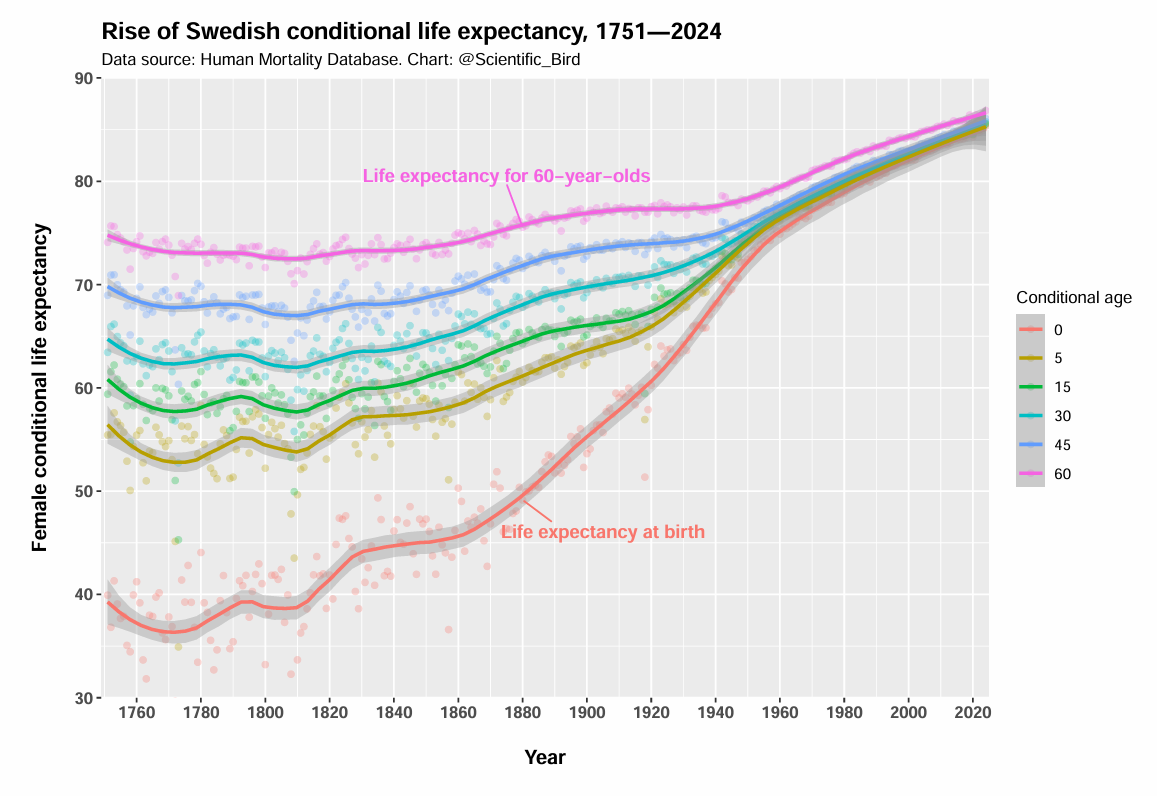
We can go further and illustrate the equivalent for many conditional ages at once. As the figure below shows, even women who managed to survive to an age of 60 years old were historically only expected to live to their early-to-mid 70s. That’s much lower than today’s life expectancy at birth. Today, 60-year-olds can expect to live to age 87. That’s twice as many additional years of life for a 60-year-old woman.
2 — Age-specific mortality rates
A second visualization approach is to look at age-specific mortality rates. As the illustration below shows, the mortality rate has dramatically declined at all ages. It is not merely mortality rates in infancy or childhood that have decreased.
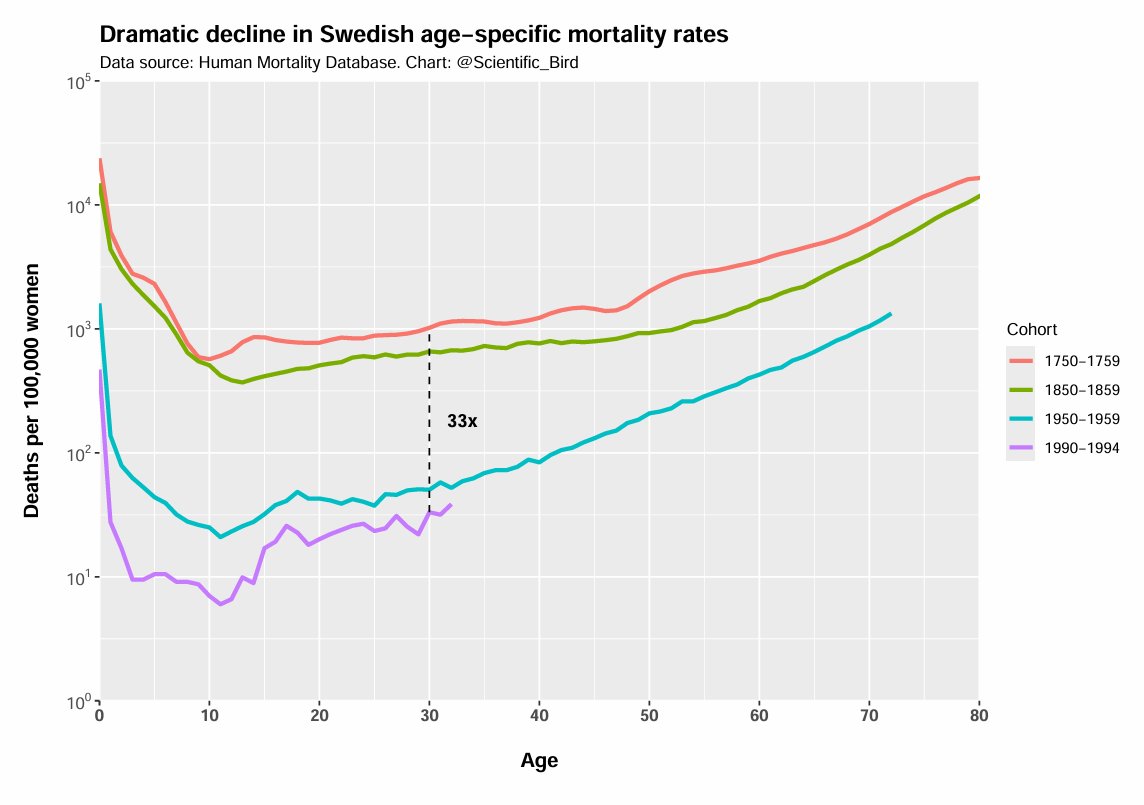
And don’t be deceived by the logarithmic axis—the differences are much larger than what they might appear visually at first glance. For example, a 30-year-old Swedish woman born in 1750-1759 was 33 times more likely to die before their next birthday than a 30-year-old woman born in 1990-1994.
The next chart illustrates the same phenomenon. But instead I’ve shown the entire time series for 5 different age groups.
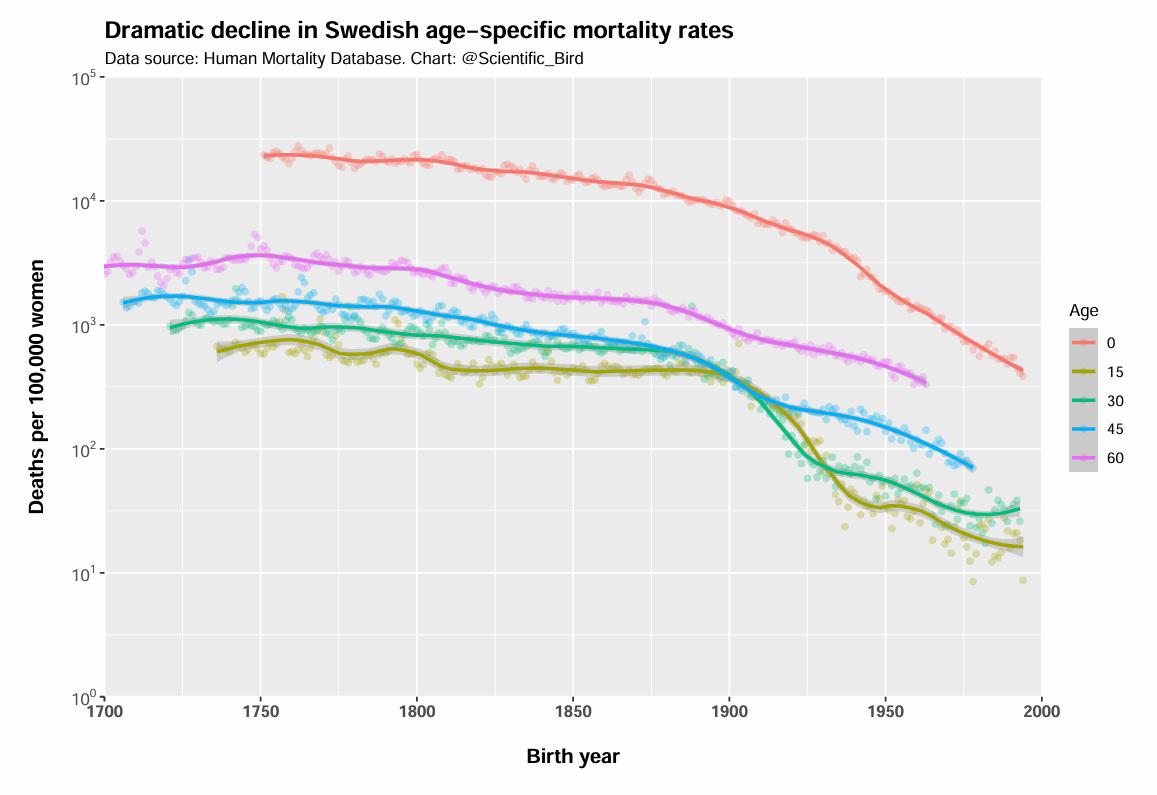
The mortality rates gradually decline over the entire period, but the decline becomes especially pronounced around the turn of the 20th century.
3 — Survivorship curves
We can also analyze the proportion who survive until a given age. I’ve shown this below, comparing the 18th century with recent data.
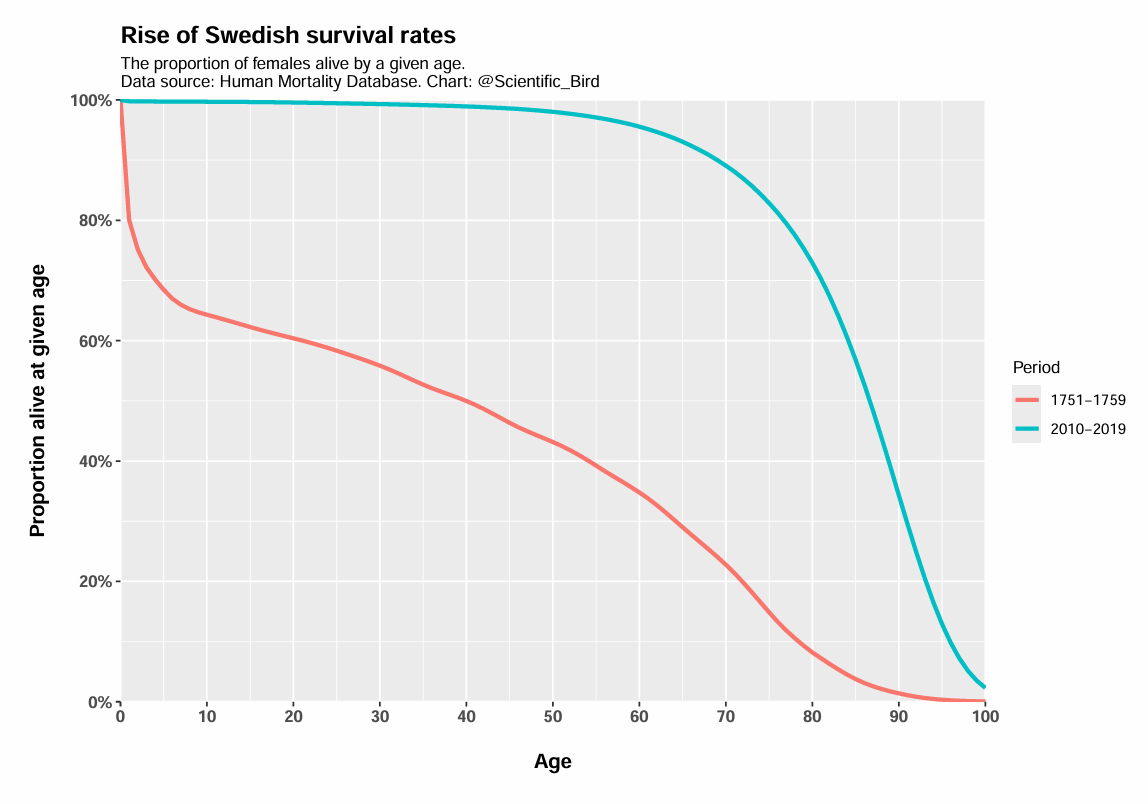
The two curves could hardly be any more different. In the 18th century, there was a much lower chance of surviving to any given age. Clearly much of this is driven by infant and childhood mortality, as indicated by the plunge in survival in the first few years of life for the 18th century period.
But is it just a matter of childhood mortality? Just as before, we can simply exclude people who don’t live beyond the first few years. I’ve taken the same data, but restricted the analysis to females that survive to at least age 10.
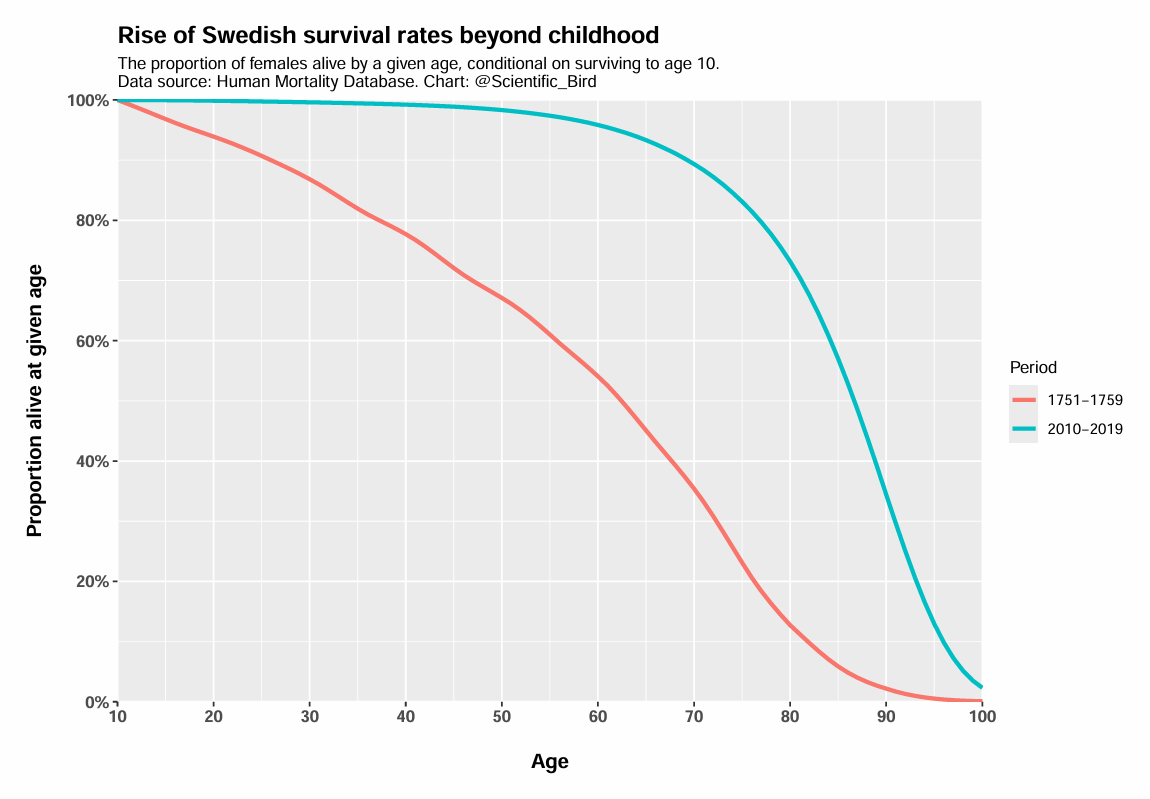
The survival curves still look very different. In the 18th century, if you survived to age 10, there was still roughly 1 in 5 chance you’d die before age 40. Only about half of 10-year-olds would survive to age 60, and 1 in 3 survived to age 70. Today, 90% of 10-year-olds survive to age 70.
How have these survival rates evolved over time? Below I have shown the proportion of Swedish females who survived to age 60. One of the curves represent the probability of a newborn surviving to age 60, the others represent the survival probabilities for those who managed to survive to age 10 and 20, respectively.
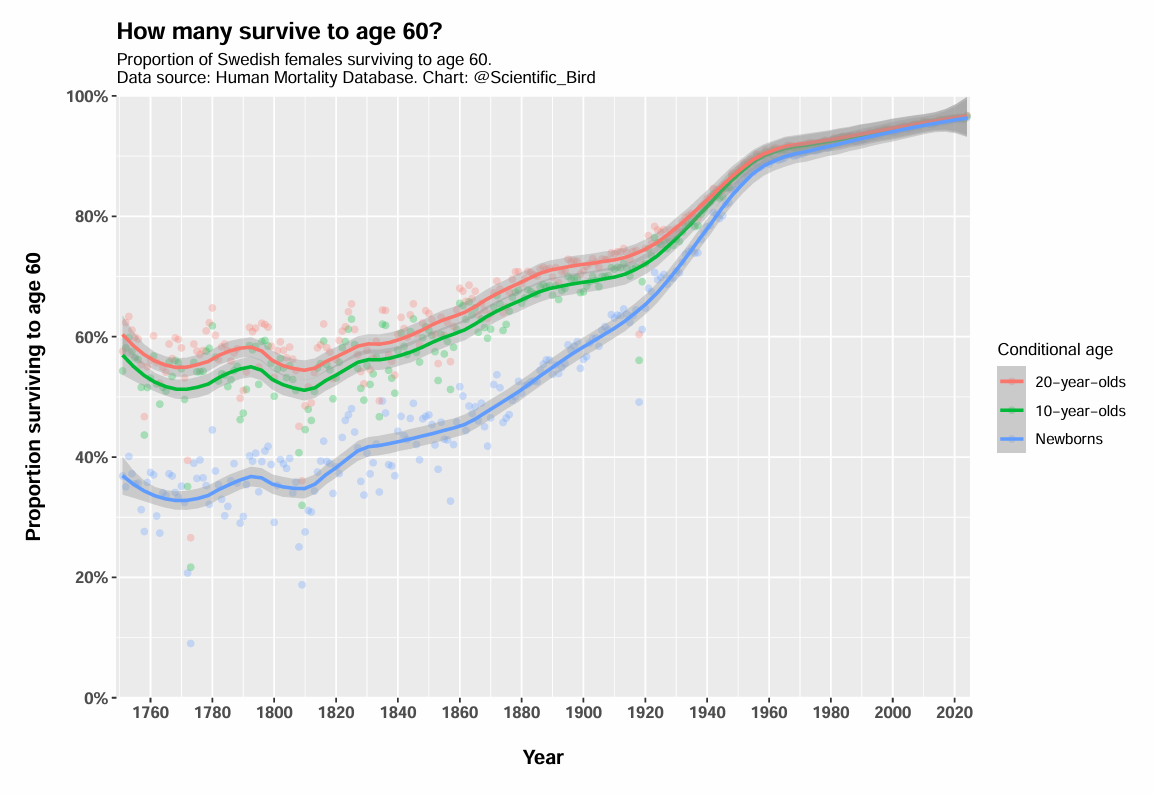
The chance of surviving to old age has enormously improved. Historically, fewer than half survived to age 60 and, even if you managed to survive to age 10 or 20, your chance was still only slightly better than a coin toss. Today, it is rare not to survive to age 60.
We can also ask, what age do X% of the population survive to? This is illustrated for various percentiles below. For example, the median line tells us the age which 50% of females lived to. As we can see, the median lifetime was a little less than 40 in the 18th century. Today, the median woman survives to age 87.
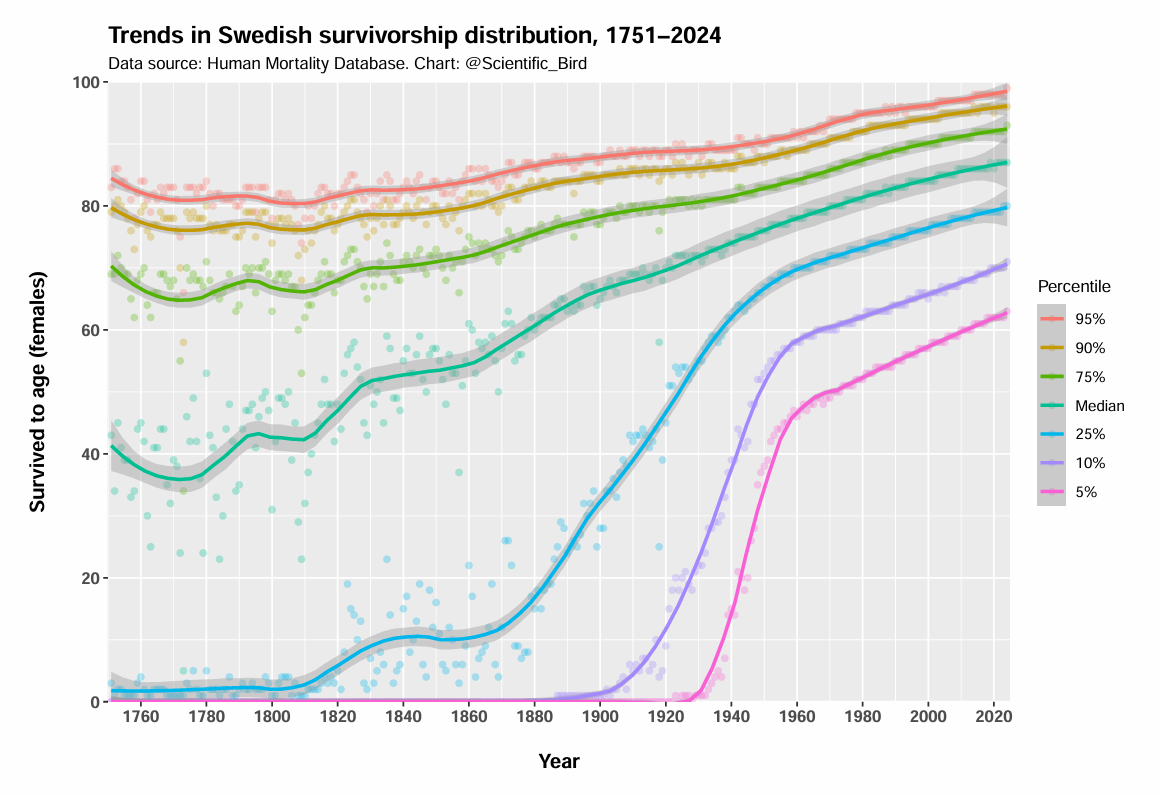
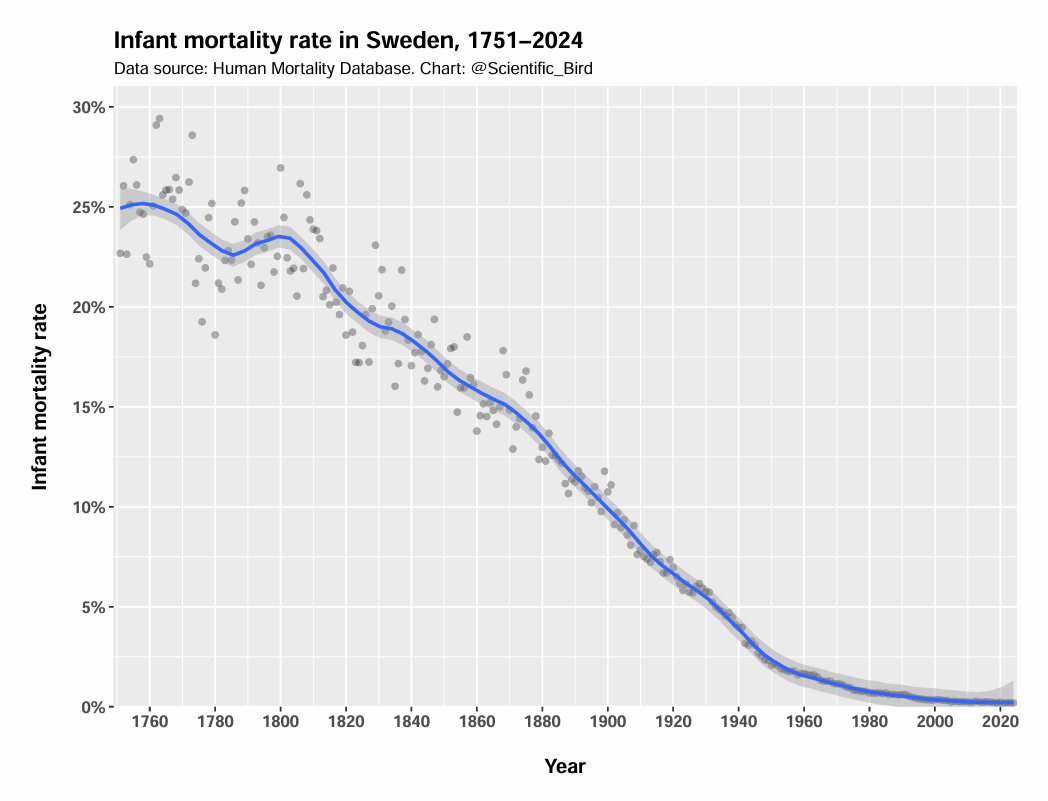
In the 18th century, the 25th percentile is just above the age of zero, reflecting that a little less than a quarter died in infancy on average. Infant mortality rate dropped rapidly over the years. By 1900, fewer than 10% die in infancy (10th percentile lifts off from the horizontal axis). And by 1930, fewer than 5%.
If we consider the other end of the spectrum, we can see that the top 5% of females (95th percentile) historically survived to the age of ~81. Even the median female lives longer than that today. In modern Sweden, 5% of women reach the age of 99. The adult lifetime has clearly greatly increased, when even the 95th percentile has grown by almost two decades.
4 — Age distribution of deaths
The change in life expectancy can also be illustrated by showing the distribution of ages at people’s deaths. The figure below shows that, in the 18th century, if you survived the first few years, the most common age of death was about 70, echoing the Bible’s assertion, “The days of our years are threescore years and ten.”
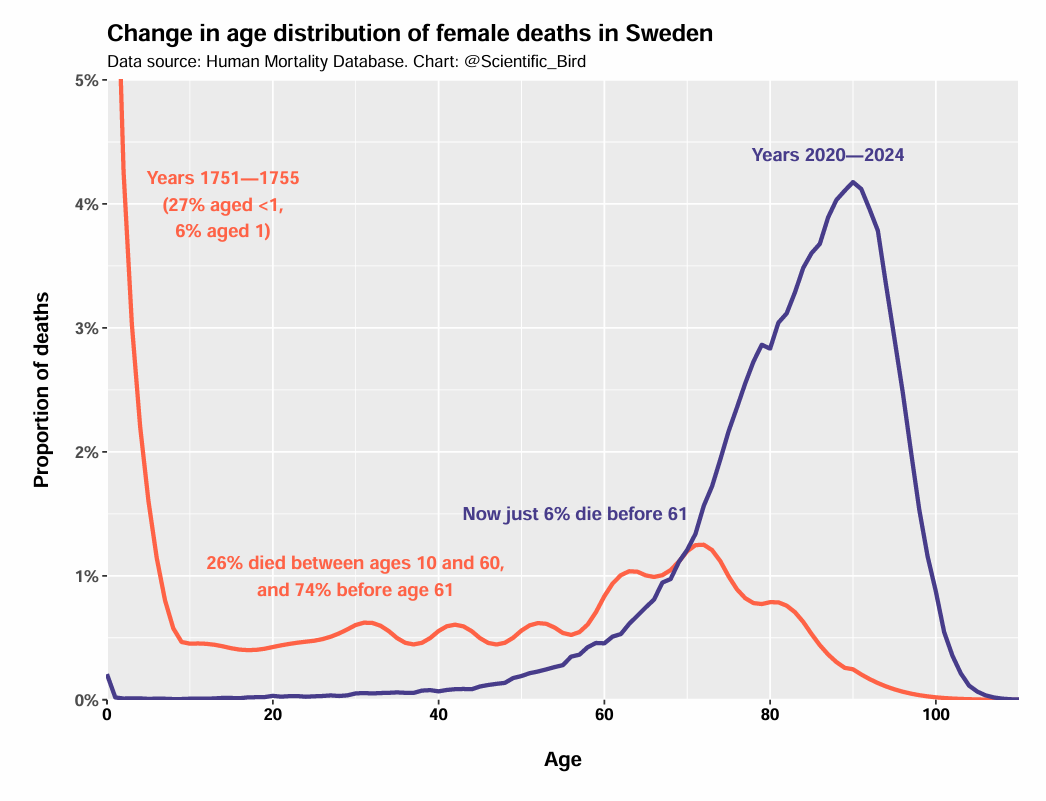
Yet we must also recognize how many used to die between the ages 10 and 60. The frequency of young adult death stands in stark contrast with modernity, where nearly all deaths are clustered at ages 60 and above. It is not just that the average has increased, the variance or “inequality” in lifetime has greatly diminished.
If we ignore infancy and young childhood, the most common age at death (“mode”) for women used to around ~70 in 18th century Sweden. Today, it is 90 years old. The mode has thus increased by 20 years, even if we discount childhood deaths.
How much is due to infant mortality reduction?
Clearly the secular rise in life expectancy cannot simply be attributed to a reduction in infant mortality. However, is it mostly a matter of infant mortality?
This is actually possible to quantify. Due to a method of Arriaga (1984), we can decompose the total change in life expectancy into individual age-specific contributions. The method properly takes into account that surviving infancy (or any other age) not only allows you to survive to your first birthday, but (most likely) let’s you live many more years.
Arriaga decomposition results are shown for the change in life expectancy in Sweden between 1751 and 2024. Specifically, I’ve shown the cumulative relative age-specific effects.
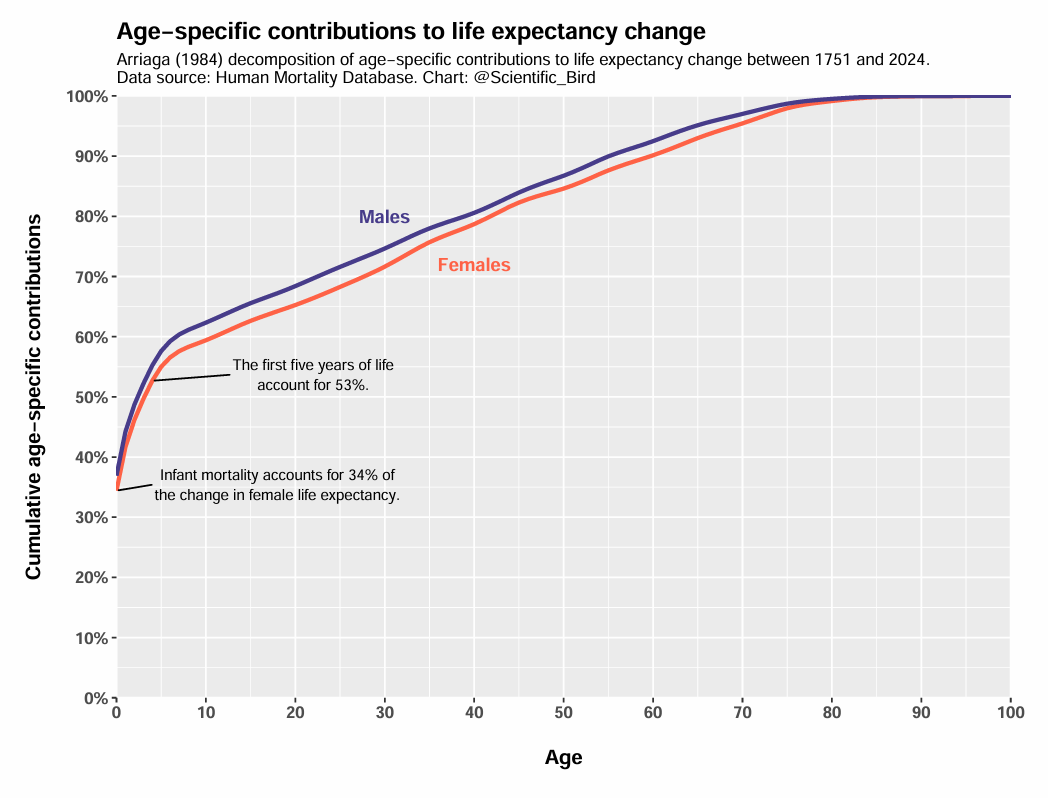
The results tell us that reductions in infant mortality (age <1) account for 34% of the female change in life expectancy between 1751 and 2024. So not only is infant mortality insufficient to explain the change, it cannot even explain the majority of the change. However, 53% of the change is explained by reductions in mortality accumulated over the first five years of life. Therefore, ages 0–4 are just barely responsible for the majority of the change.
The importance of reduction in adult mortality shouldn’t be overlooked. About 32%-35% of the life expectancy increase is due to reduced mortality at ages 20 and up. That is similar to the contribution of infant mortality.
A simple summary is that the total increase in life expectancy between 1751 and 2024 can in roughly equal parts be explained by the contributions of (a) the first five years of life, and (b) ages 5 and above.
Causes and prevention of death
The causes of mortality vary in time and space. In the 14th century, Europe was ravaged by bubonic plague (“The Black Death”). Sweden too was struck between 1350 and 1351, and also by recurring outbreaks of bubonic plague in the following centuries. The last major outbreak in Sweden was in 1710, representing the largest spike in mortality rate between 1650 and 1950 (see below).
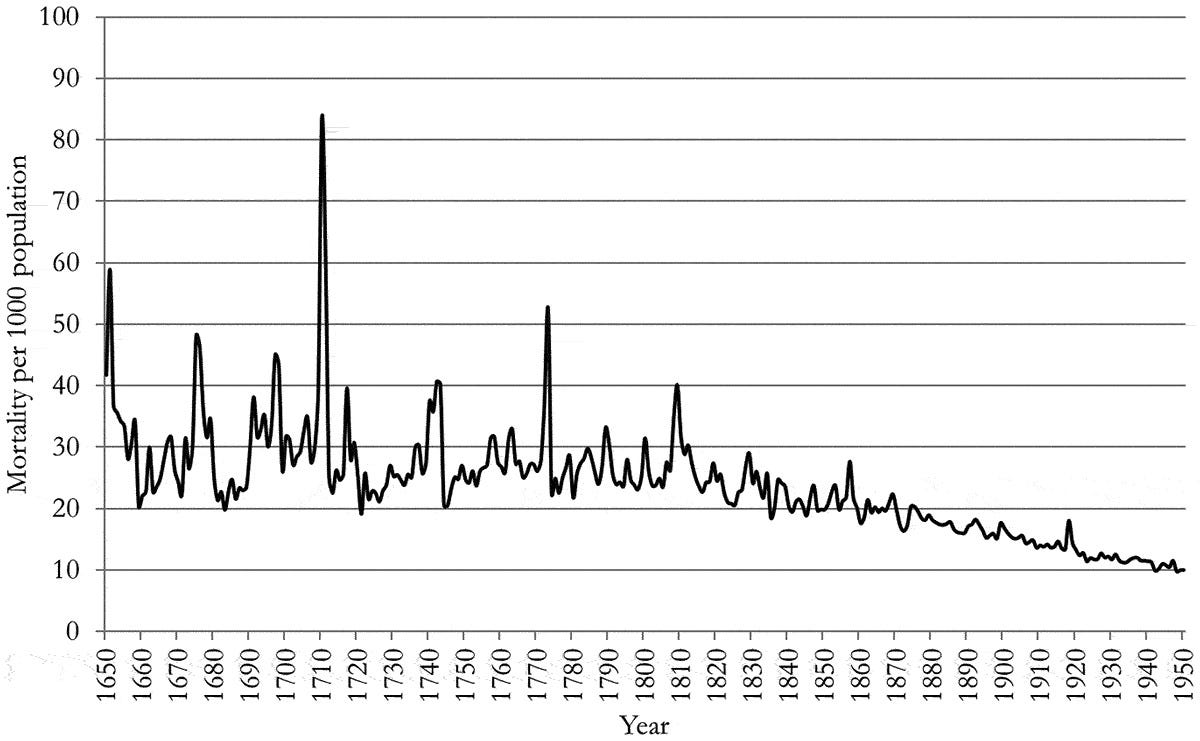
With the establishment of Tabellverket in 1749, we can make more reliable assertions about the dominant causes of death in the latter half of the 18th century in Sweden.
These were smallpox, dysentery, fevers (e.g., typhoid), tuberculosis (historically, “consumption”), as well as other infectious diseases such as measles and whooping cough. Some of these causes of death were exacerbated in times of poor harvests and famine. In the 1830s, Sweden was struck by epidemics of cholera, a new disease originating from India in 1817.
Some causes of death were more sex-specific. Victims of war were mainly men, however war deaths represent only a small share of all deaths in the period 1750-1800. As for women, childbirth was a serious risk. Even still, in 1751, maternal deaths accounted for “just” 10% of female deaths in the 15-49 age group (Högberg & Wall, 1986), and a much smaller share of all female deaths.
The vast majority of deaths (including adult deaths) were therefore from general causes that were not highly differentiated by sex.2
Prevention of death
Clean water, proper sewage systems, medication and vaccines all contribute to modern public health. Waterborne diseases like cholera, dysentery, and typhoid were primarily reduced by better sanitation systems. Vaccines have helped tackle respiratory and person-to-person transmitted diseases, such as smallpox, measles, and whooping cough.
I’ll briefly describe some of the major public health breakthroughs, ranging from sanitation, to vaccines and antibiotics. Out of brevity, I will not discuss each in-depth, nor address any potential controversies here.
To help combat maternal deaths, Sweden implemented midwife training in the early 18th century. Additional midwifery programs led to reduced maternal mortality in the 19th century (Lorentzon & Pettersson-Lidbom, 2021). In 1847, Ignaz Semmelweis famously proposed that doctors and midwives should wash their hands with chlorinated lime solutions. In 1879, Swedish midwives were required to wash their hands before performing procedures.
Variolation (deliberate infection to develop resistance) had been used in Sweden to address smallpox since the 1750s, though it wasn’t widespread (Sköld, 1996). Edward Jenner’s smallpox vaccine of 1796 was the major advance; it was safer and could be more widely applied. In 1816, vaccination of children became mandatory by law in Sweden (Gustavsson, 2024). Sweden was the first major country to eliminate indigenous smallpox, which it achieved in 1895. By 1980, smallpox had been globally eradicated.
In 1854, John Snow’s work in London linked cholera to contaminated water, which influences urban planning. Water supply and sewer systems were soon established across Finland and Sweden. In addition to public health justifications, water supplies were also necessary for efficient firefighting, and sewers are important for drainage to protect buildings (Juuti et al., 2009). Repeated improvements in sanitation systems helped reduce waterborne diseases (cholera, dysentery, typhoid).

In the 1930s, sulfa antibiotics were introduced, and penicillin in the 1940s. Antibiotics are used to prevent or treat infections, and have been instrumental in addressing tuberculosis—the last of the diseases that was a major killer in the preceding century.
Less obviously, antibiotics have also been responsible for a reduction in stillbirths. The major turning point in stillbirth rates coincided with the 1930s (Woods, 2008), as I’ve shown for Nordic countries below.
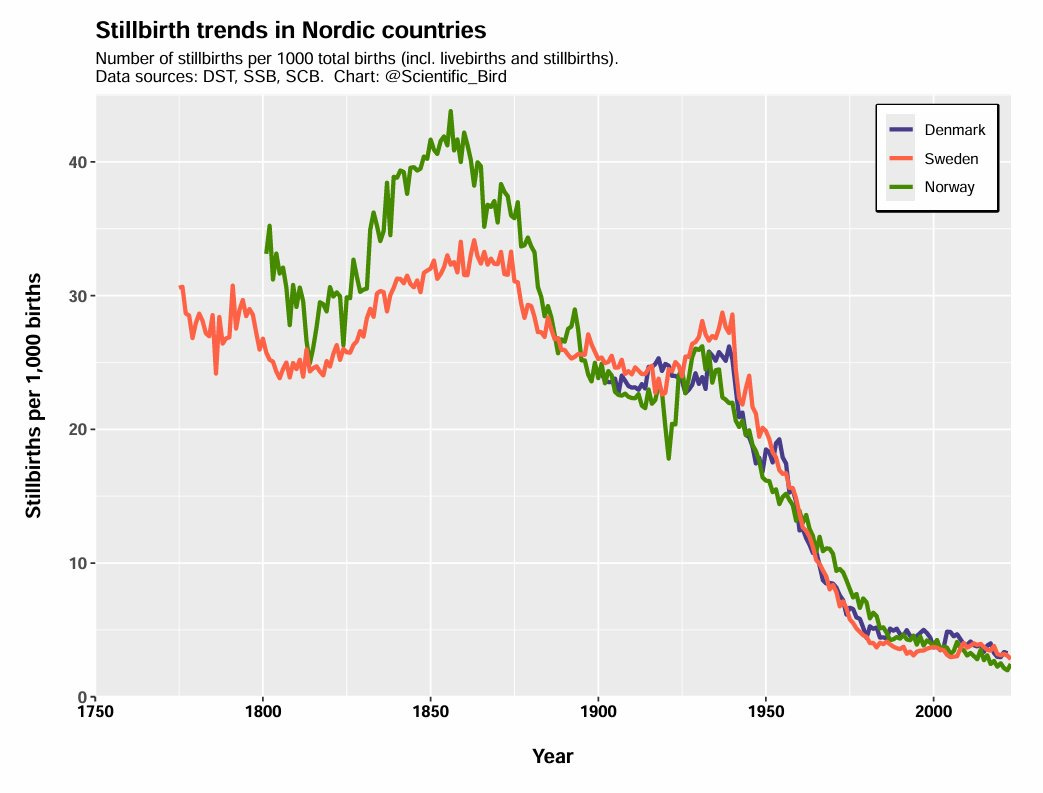
The decline not only perfectly matches the timing of antibiotics (and not other obvious candidates, such as frequency of c-section use), but Løkke (2012) analyzes detailed Danish cause-of-death data and finds strong support for the importance of antibiotics.
Antibiotics not only helped cure non-obstetric infections before and during pregnancy, they also allowed more invasive interventions to save the fetus without wanton hazard to the life of the mother. This reduced the number of stillbirths.
Conclusion
In this post, I have illustrated the rise of life expectancy in Sweden in several ways. The basic conclusion is that, though infant mortality is a major part of the story, life expectancy has greatly increased even beyond infancy and childhood.
Arriaga decomposition shows that reduction in infant mortality accounts for a third of the increase in life expectancy in Sweden. This is similar to the cumulative effects of reductions in mortality rates at ages 20 and above.
While war and maternal deaths were serious risks and highly differentiated by sex, the vast majority of deaths were due to more generic causes. In 18th century Sweden, these were particularly smallpox, dysentery, typhoid fever, tuberculosis, and other infectious diseases such as measles and whooping cough. In the 19th century, cholera arrived and was responsible for a large share of deaths.
These deadliness and prevalence of these diseases have all been greatly reduced, due to a combination of public health measures, including improved sanitation, vaccines, medication and sufficient nutrition.
I will mainly use Sweden as illustration because of its long time series compared to other countries. However, the broad trends are consistent across all Western countries (though may differ in detail). The data is supplied by the Human Mortality Database.
This is not to say that males and females had the exact same rate of mortality from causes like smallpox or tuberculosis. In fact, boys had slightly higher mortality rates from many diseases. However, these differences are modest when compared to war or maternal deaths, obviously.
This is excellent. Thank you!
It amazes me that plenty of people in the past lived to even 50 or 60. The absence of antibiotics alone would lead to many deaths. In my 50s, I somehow got an E. coli infection that spread to kidneys. I was going into septic shock and stayed in hospital for 6 days. I presume I would have died without medical help. That's just one possible cause. There was nothing to be done about a burst appendix. Etc.
Also, I appreciate your detailed confirmation of what I have been saying: That a major part of the increase in life expectancy is not due to a reduction in infant/early childhood deaths. I have been saying it is about 50/50 which matches your number for life expectancy after age 5.