When Lightning Strikes... Literally
A quantification of the risk of dying from a lightning strike and other external sources of harm
What is the probability of getting struck by lightning? “When lightning strikes” has become a metaphor for anything extraordinarily unlikely. This post is a deep dive into a rabbit hole inspired by this question. What initially was just about lightning strikes made me want to compare this risk to other “external” sources of death.
Overall between 2015-2020, according to the CDC, 1,479,620 (8.5%) deaths out of a total of 17,348,153 deaths were due to “external” causes, which includes various accidents (transport accidents, falling, complications of healthcare, etc), murders, self-harm, weather phenomena, animals, et cetera.
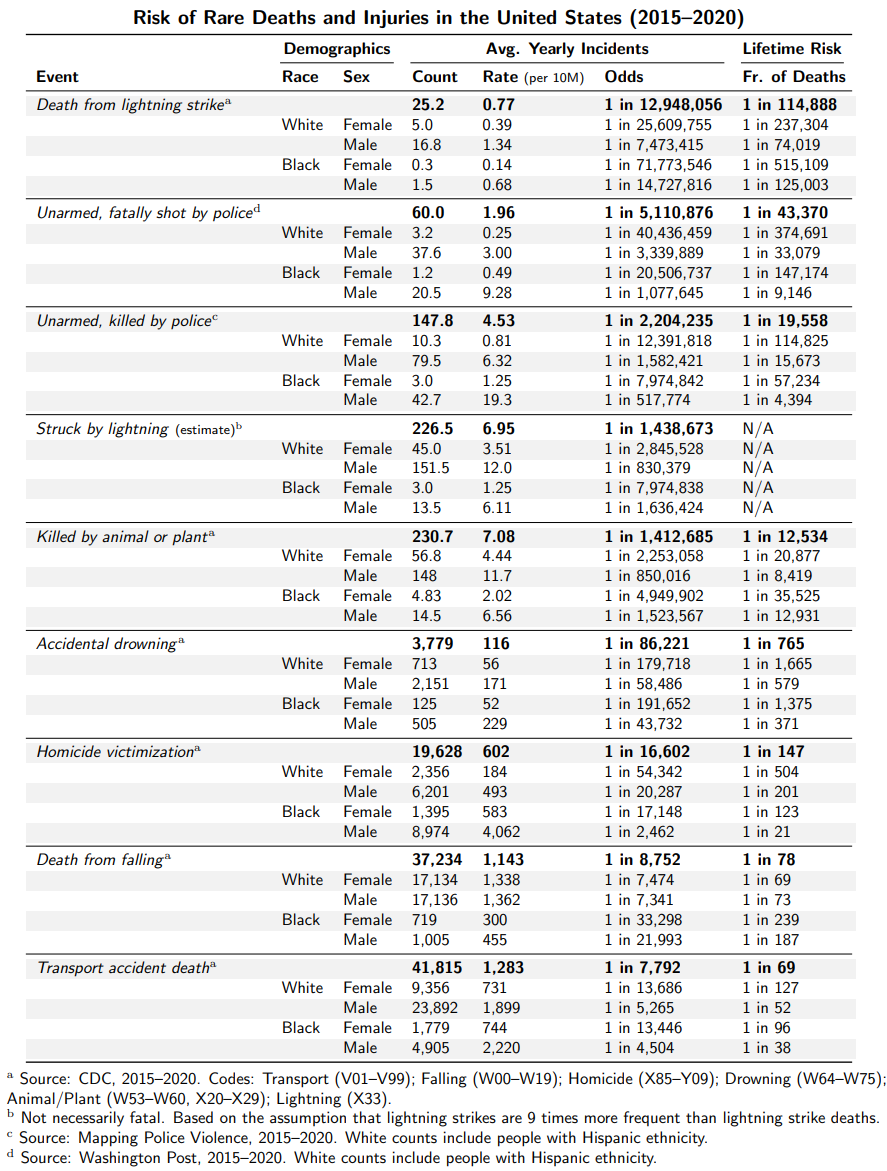
The table below presents the summary of my findings about the risk of select external sources of harm by race and sex. The table displays three quantities related to the yearly risk. First, the yearly raw number of incidents in that demographic over the period 2015 to 2020. Second, the per capita rate (in per 10 million people). Third, the yearly odds. The final column provides, where applicable, the fraction of deaths in that demographic that is due to the given cause (in the period 2015 to 2020), an indicator of lifetime risk.
Death from lightning strike (1 in 13 million per year)
The idea of being struck by lightning has almost become synonymous with an extraordinarily rare event. And, indeed, it is very, very rare. Between 2015 and 2020, the CDC recorded 151 fatal victims of lightning. Across 6 years in a nation of 300+ million people, that is remarkably rare. It amounts to one fatal victim of lightning per 13 million people per year, and it accounts for just 1 in 115,000 deaths in the period.
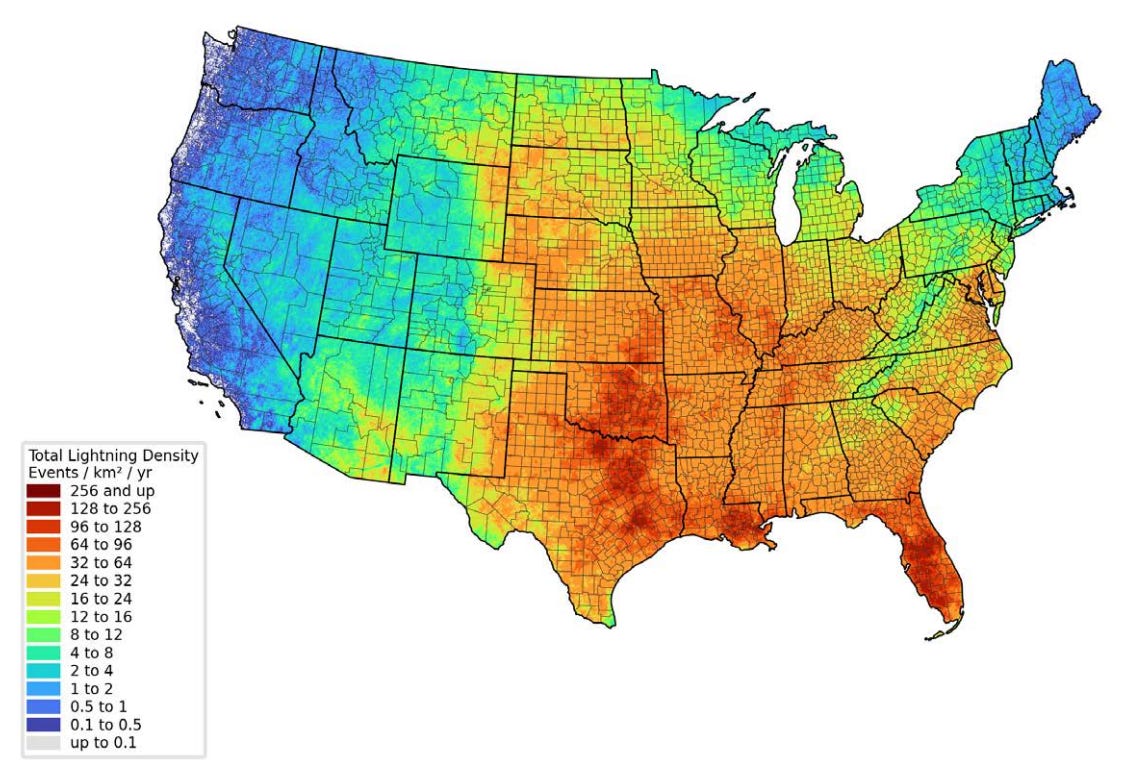
Even for such a seemingly random event as a lightning strike, the risk is not uniformly distributed (see CDC). It is a climatic phenomenon and, in the US, victims of lightning happen disproportionately in the summer in the southern states. Being outside, due to work or recreational activities (e.g., fishing) also increases risk. Males are also about 4 times more likely than females to be victims, and white people have higher risk than black people. I speculate that those disparities are driven mainly by differences in recreational activities, but possibly also rare risky behavior.1

Killed/shot by police while unarmed (1 in 2.2/5.1 million per year)
To estimate risk of police killings, the data sources used are by the Washington Post (fatal shootings) and Mapping Police Violence (killings by any means).2 Being killed by police while unarmed happens to an estimated 1 per 2.2 million per year. The shooting data is arguably more reliable, but by definition only includes a subset of police killings. The risk of getting fatally shot by police while unarmed is 1 in 5.1 million per year.
Police killings of unarmed people are certainly rare. The above risks imply that the risk in the general population is somewhere between the risk of being struck by lightning and dying from it.3 For black men the risk is highest, and they are approximately 3 times more likely to die while unarmed in a police encounter (or 1½ times more likely to be shot by police while unarmed) than being struck by lightning. Still, being well within an order of magnitude from being struck by lightning means it is still very rare.
Lightning strike injuries (1 in 1.4 million per year)
Dying from a lightning strike is not the same as being struck by lightning. To my surprise, almost 90% of people struck by lightning survive (CDC). Therefore, as an admittedly rough estimate, I take the risk of being struck by lightning as 9 times the risk of death by lightning. Given that, being struck by lightning (and likely surviving) has a yearly risk of approximately 1 in 1.4 million people.
If such a risk was constant across years, then this would suggest that the risk of getting struck over a 50-year-period at least once by lightning is approximately 1 in 29,000. Still a very low risk, and said risk is undoubtedly clustered in specific people atypical in geography and behavior.
Killed by animal or plant (1 in 1.4 million per year)
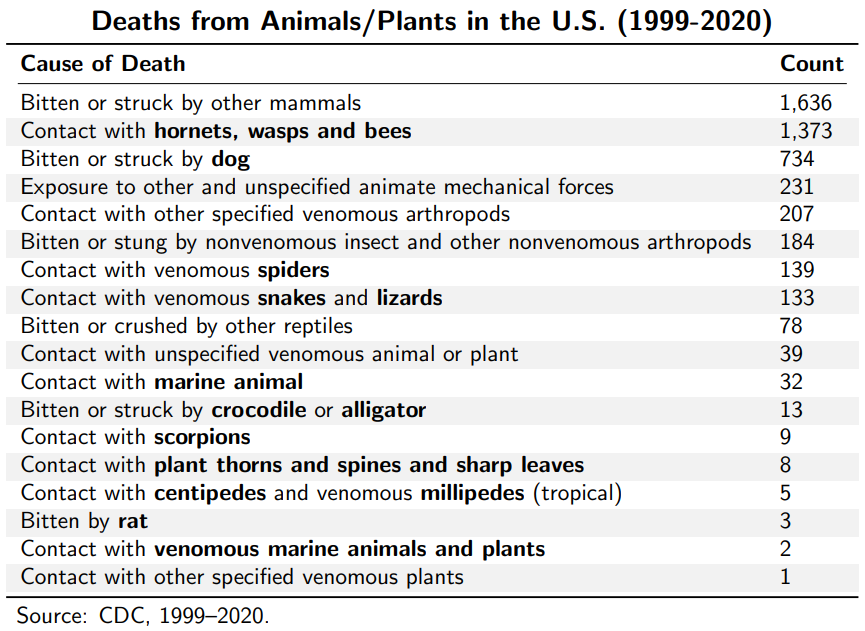
Every year in the United States, approximately 1 in 1.4 million person is killed by an animal or plant. The following table shows which animals are responsible.
Ignoring “other”-categories which group together countless species of great variety; hornets, wasps and bees are responsible for most human deaths. Of wild animals, they are probably responsible for most deaths too.4
This is followed by dogs, which surely is the kind of animal that people have most contact with. Thus, the risk is low relative to the amount of contact. I have previously found that fatal dog attacks are typically by pit bulls (62%), rottweilers (7.6%), shepherds (5.4%), mastiffs (4.6%), bulldogs (3.7%), and the remaining by other breeds, each responsible for fewer deaths.
Each year, a handful die from venomous spiders (139 deaths between 1999 and 2020), venomous snakes and lizards (133). And, on average, less than one person per year dies from crocodiles and alligators (13), scorpions (9), contact with plant thorns, spines and sharp leaves (8), or from being bitten by a rat (3).
Accidental drowning (1 in 86 thousand per year)
We’re reaching causes of death where the risk is no longer negligible, with the following causes each accounting for more than 1 in a 1,000 deaths. The yearly risk of accidental drowning is 1 in 86 thousand and 1 in 765 deaths can be attributed to it. Males have substantially higher risk, as they do for most of these causes, I think reflecting a difference in risky behavior (swimming while intoxicated, surfing, etc).
Homicide (1 in 17 thousand per year)
Relative to other causes of death discussed, deaths due to homicide are much more common. Still, the risk of homicide is still quite small in general, accounting for less than 1% of all deaths. However, the relative risk of homicide varies greatly with demographics, with males and black people having higher risk. For white women, the yearly homicide risk is about 1 in 54,000 and accounts for 1 in 504 deaths. For black men, the yearly homicide risk is about 1 in 2,500 and accounts for 1 in 21 deaths. Among young black men it is the leading cause of death (CDC).
Death from falling (1 in 9 thousand per year)
Unlike many other causes discussed here, falling deaths affect mainly the elderly and frail, and thus a group’s risk is highly affected by its age composition. While the yearly risk is 1 in 9 thousand in the general population, the yearly risk is less than 1 in 100,000 among young people and about 1 in 1,000 among 80-84-year-olds.
There are also falling accidents that can be considered the result of risky behavior or more extreme accidents rather than frailty. Between 2015 and 2020, 706 falling deaths involved ice or snow; 526 fell from a cliff; 370 involved ice-skates, skis, roller-skates or skateboards; 362 fell from a tree; 235 fell on or from scaffolding; 200 were diving injuries (other than drowning); and 20 fall deaths involved playground equipment.
Transport accident deaths (1 in 8 thousand per year)
Among the selected causes of death, transport accident deaths are the most common in the general population. The yearly risk is about 1 in 8,000 and about 1 in 69 deaths are due to transport accidents. Unsurprisingly, the risk is higher among males.
Conclusion
Of external causes of death analyzed here, the highest risk is black men dying from homicide, accounting for 1 in 21 of black male deaths in the period between 2015 and 2020. This is followed by traffic accident deaths for black males (1 in 38 deaths) and white males (1 in 52 deaths), respectively.
But most of the causes of death analyzed are very rare, most notably what inspired the analysis in the first place: over a lifetime, the risk of dying from a lightning strike is rarer than 1 in 100,000.
We should also keep in mind that risk is not uniformly distributed. The estimated risk of homicide victimization includes those actively engaged in criminal activity, the risk of drowning includes those who swim while heavily intoxicated, and so on. Thus, unless you’re engaging in obviously risky behavior or you’re present in an obviously risky situation, there is much less reason to worry. The risk that you, the reader, will die of these causes is probably much smaller than the given estimates. Don’t do obviously stupid things, and you’ll probably be fine. Do drive safely, though.
Recreational/leisure activities appear to be especially important as lightning strike deaths occur most often on weekends, particularly Saturdays. According to the CDC, “leisure activities such as fishing, boating, playing sports, and relaxing at the beach accounted for almost two-thirds of lightning deaths.” It is noteworthy that white people are at higher risk of dying by lightning, despite black people residing disproportionately in the high-risk Southern states. It is possible that a black-white behavioral differences are large enough to exceed the effects of geography, but I am not aware of good evidence speaking to the question.
The Washington Post police shootings database is often considered more reliable, but the downside is that it only tracks shootings. Mapping Police Violence is compiled by data scientists and activists. It contains killings by police using any means, not just shootings.
It should be noted that unarmed does not mean unthreatening or legally unjustified. Unarmed individuals could include, among other things, people who are in the process of physically assaulting a person (including the police), violently resisting arrest, and criminals attempting to grab a police officer’s weapon. To assess whether a case is legally justified, one needs to assess the case specifics, which is not the purpose here.
This is true even if the assumption of lightning strike victims being 9 times as common as deaths from lightning strikes is not quite true. Lightning strike victims have to be less than 6 times as common as lightning strike deaths for it to not be quite true.
The closest animal category are dogs, however they are overwhelmingly not wild animals. Beekeeping is the probably the only major source of “non-wild” bees, but I do not know how many deaths from bees can be attributed to beekeeping versus contact with bees, wasps and hornets in the wild.


