
Racial Homicide Disparities Since 1910

Drawing from uniform crime reports since 1933 and vital statistics since 1910, I document the evolution of black-white homicide disparities in the United States since the early 20th century.
Homicide Arrests
The Uniform Crime Reporting program began in 1929 to compile national crime statistics, and since 1933, arrests by race have been reported. An early example is the following 1934 report showing per-capita arrest rates by race for various crimes:
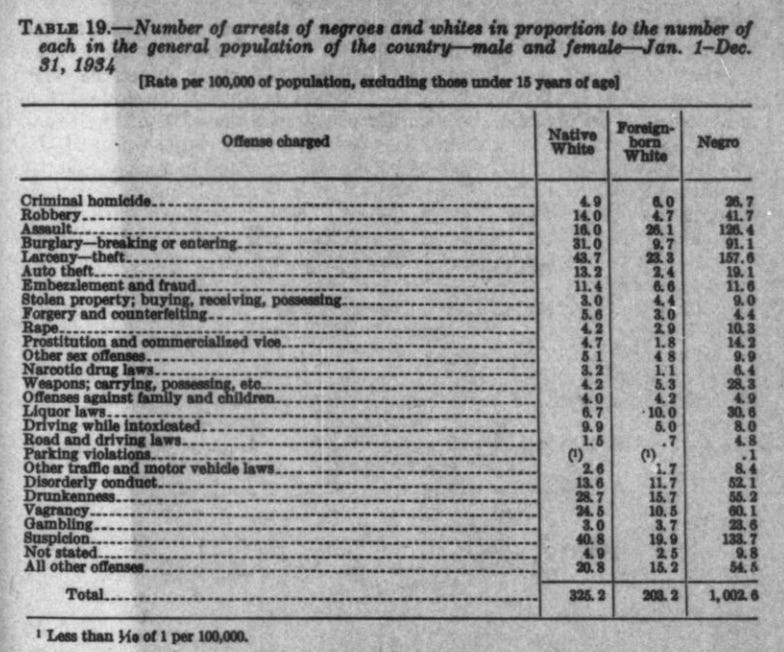
But per-capita rates are only reported for a select few years (1933-1940). Beyond then, just total arrest counts have been reported. I went through all Uniform Crime Reports since 1933 and recorded the homicide arrest counts by race. For some years, arrest counts are also only reported for cities (with population of at least 2,500). The counts are shown below.

Population Numbers
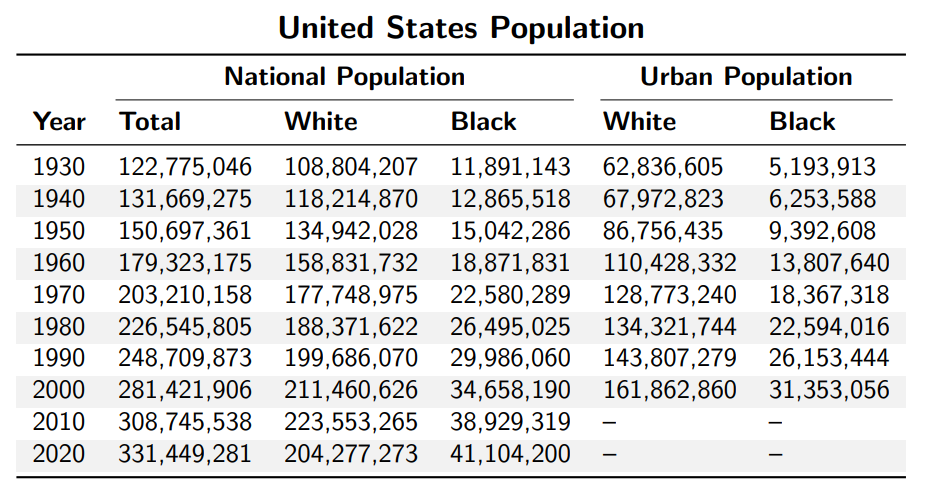
To calculate arrest rates, we need arrest counts and the sizes of the respective populations. I went through each decennial census since 1930 and found white and black populations, both national and urban populations (except 2010 and 2020 for which I could not find urban populations by race). Urban population is necessary knowledge to calculate rates for the years which only report arrest counts for cities. Of course, the fraction of the population which resides in urban areas has increased over the decades, but this is especially true for black people. In 1930, 57.8% of white people and 43.7% of black people were urban. But in 2000, 76.5% of white people and 90.4% of black people were urban.
Homicide Arrest Rates
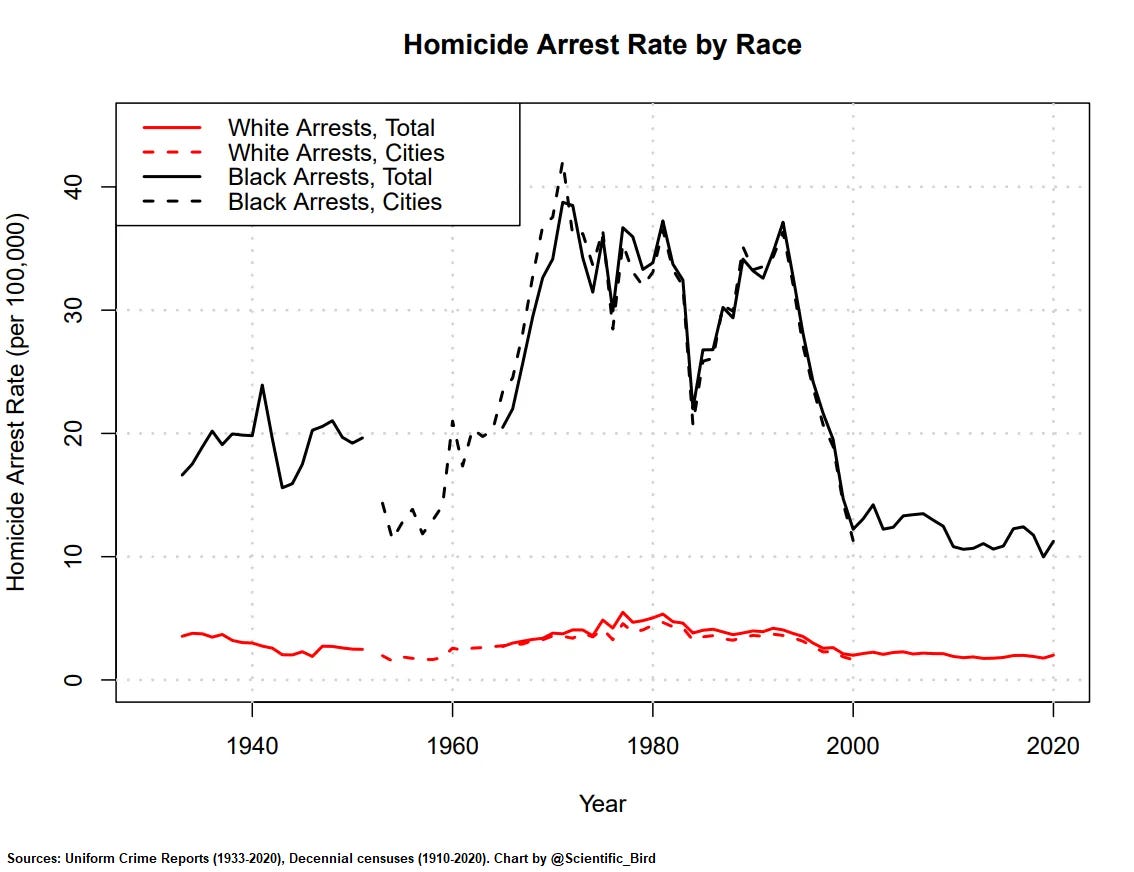
With arrest counts and population sizes (linearly interpolating between decades), we can now calculate homicide arrest rates. This is shown below.
Homicide Victimization Rates
Can we go earlier than 1933? Yes. Since most homicides are intra-racial (that is, perpetrator and victim are of the same race), victimization rates are decent approximations of perpetration rates.1
Deaths and their causes are tracked in Vital Statistics, and this includes deaths due to homicide.2 Since 1910, homicide victimization rates have been available in two race categories: white and non-white. The CDC provides the data since 1968 for both white and black people. The homicide victimization rates by race from 1910 to 2020 are shown below.

The black and non-white rates have also been increasingly diverging over time, a predictable consequence of an increasing population share that is neither black nor white. Before 1965, “non-whites” were comprised almost entirely of black people. In the 1960 census, just 0.9% of the population were races other than white and black. Thus, before the ‘60s, the non-white and black rates would be very similar.
Homicide arrests and victimization, combined
We can also plot both homicide arrest rates and homicide death rates together. I use national arrest rates where available and otherwise use city arrest rates. This is illustrated below.

It is noteworthy that arrest rates and death rates match fairly closely in the period from the ‘60s to late ‘90s. After 2000, arrest numbers have been substantially lower than death rates (with the largest gap in 2020), likely reflecting a drop in policing. It is known that the black-white homicide clearance rate disparity has been widening in the last few decades, thus it is likely that black homicide offenders are disproportionately avoiding arrest.
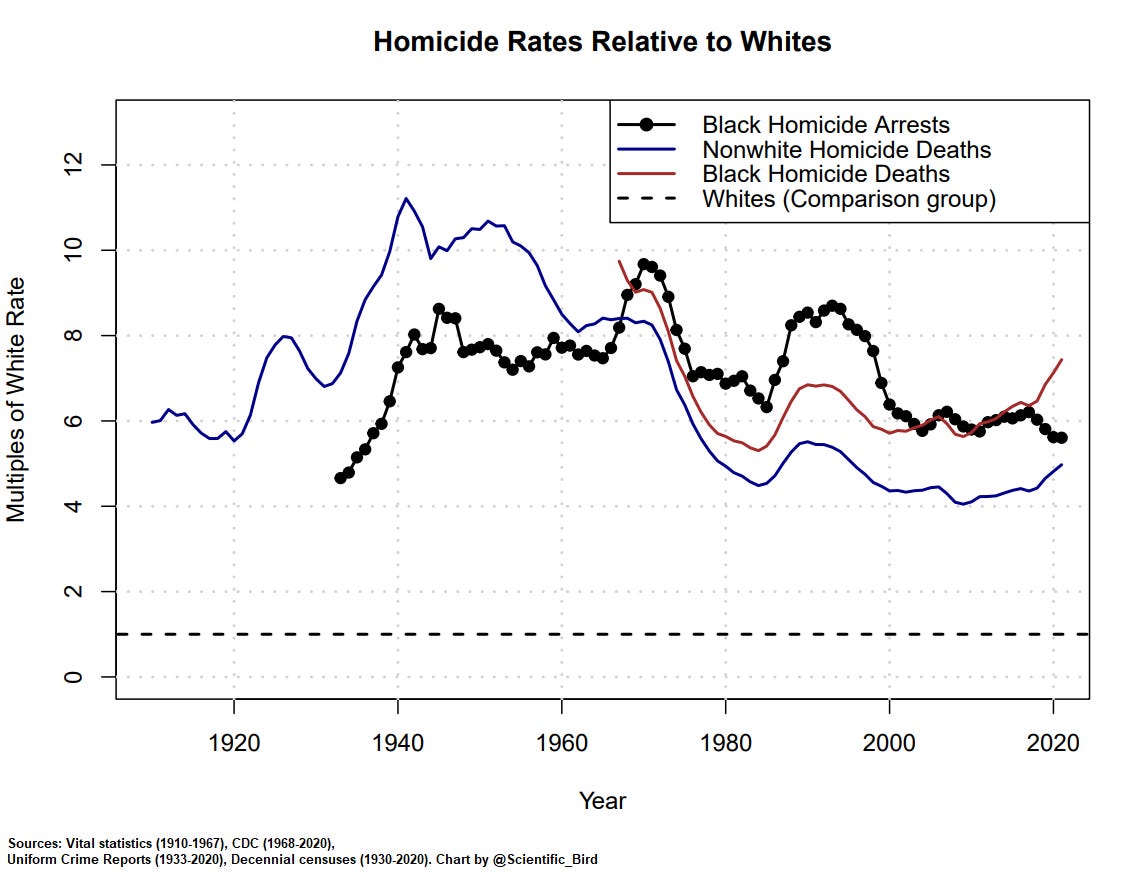
Below I show the arrest and victimization rates in terms of multiples of the white rate.
Conclusion
Racial homicide disparities have been large for as long as good data is available. Since 1933, black people have generally been arrested for homicide at 5–9 times the rate as white people. And since 1910, black people have died from homicide 6-11 times the rate of white people.
In fact, at least since 1980, we know that the victimization rate is an underestimate of the black perpetration rate and an overestimate of the white perpetration rate. We know this because there are more black-on-white homicides than vice versa, thus the net effect on victimization rates is in that direction. For more details about this, read a previous blog post of mine.
I love this sort of clear presentation of historical data. I advance the fiscal sink hypothesis about crime patterns in the US here.
https://lorenzofromoz.substack.com/p/race-and-other-annoyances
Anytime anyone says "crime is down compared to the crack wars of 1990" I ask if that is the relevant date to compare to.
I think most people as a comparison have in their minds the kind of public order we had up until the late 60s and beyond (the racial riots can mark the beginning of this).
Another problem with using the stats is that attempted murders become murders about 80% less then they used to before the trauma care innovations of the Vietnam War saved a lot of gunshot victims.
In any even I think the level of "acceptable crime" in the black community is just too high for most whites. When it reachers "1990 crack war" levels even blacks will start demanding broken windows policing, but even historically low points in black crime are just way above that whites will accept.