Race, economics and homicide
Can economic disparities account for racial homicide disparities?
Introduction
It is widely believed that poverty is the mother of crime. Having analyzed crime disparities between groups in various contexts, by far the most common response is related to this one way or another. Typically phrased in the form of a question whether, or a suggestion that, crime disparities disappear if socioeconomic status is accounted for. In the American context, racial crime disparities are especially often thought to be explained by differences in economic opportunity, at least to a large extent. In this piece I therefore ask: can black-white disparities in poverty account for disparities in homicide perpetration?
The short answer
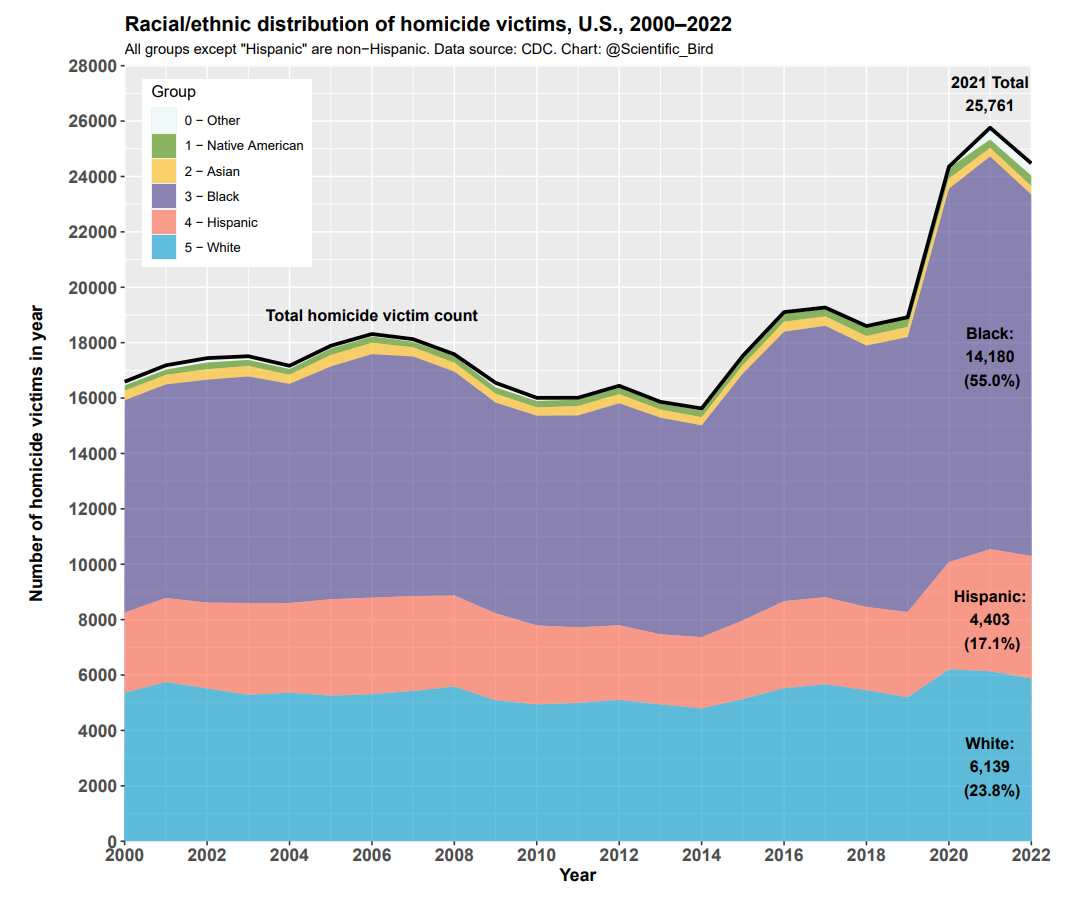
In truth, solving this question does not require any sophisticated data analysis. It can confidently be answered in the negative with a simple observation: above 50% of homicides in the United States are perpetrated by black people.1 If poverty were to account for the homicide disparities, at least 50% of Americans in poverty would need to be black. In reality, just ~20% of people in poverty are black (Shrider & Creamer, 2023). QED.
That settles the question. It follows immediately that non-black people must have lower rates of homicide offending, even once poverty is accounted for. This is because, in raw numbers, there are more non-black poor people than poor black people (80% vs 20%), but there are more black homicide offenders than non-black homicide offenders (>50% vs <50%). So even hypothetically if all homicides were committed by people in poverty, a smaller group of poor people would be responsible for a greater number of murders — i.e., the homicide rate is higher. The observation here is that, while black people are overrepresented among the poor, they are not sufficiently overrepresented such that it could account for the homicide overrepresentation relative to non-black people. Poverty alone cannot explain the disparity.
Data analysis
None of this means we shouldn't do the relevant data analysis. Often the details pertaining to such a question are just as (if not more) interesting than the basic yes/no answer.
To address the question, I combine homicide victimization data (CDC) and economic data (American Community Survey), both on the geographical level of counties. They provide data separated by race/ethnicity within each county.2 I focus on homicide, in part due to its severity, but more importantly because it is the violent crime for which we have the best and most reliable data.
As far as I'm aware, no one has conducted this analysis before. There are some analyses with obvious similarities. However, these analyses generally don't separate the economic indicators by race within the geographical units of analysis. For example, Levitt (1999) analyzes black and white homicide victimization rates and how they relate to community median household incomes. However, the median is calculated for all people living in those communities, not separately by race within the community. Because there are racial economic disparities within geographical units, white and black people sharing a community does not fully account for economic disparities. My analysis accounts for that. That is, I will compare black people who earn, say, $30,000 with white people who also earn $30,000.
Results
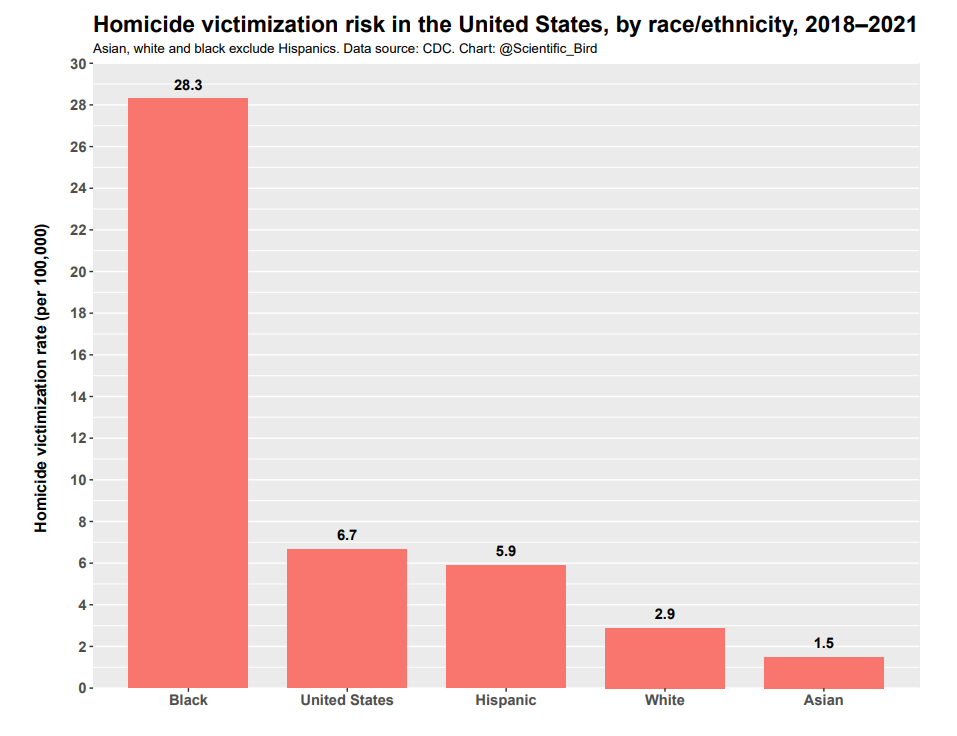
For context, it is useful to have the relevant figures when unadjusted for economic differences. Between 2018 and 2021, the national homicide victimization rate among non-Hispanics was 2.9 per 100,000 for white people and 28.3 per 100,000 for black people — a 9.8-fold difference. The unadjusted national rates are shown below.
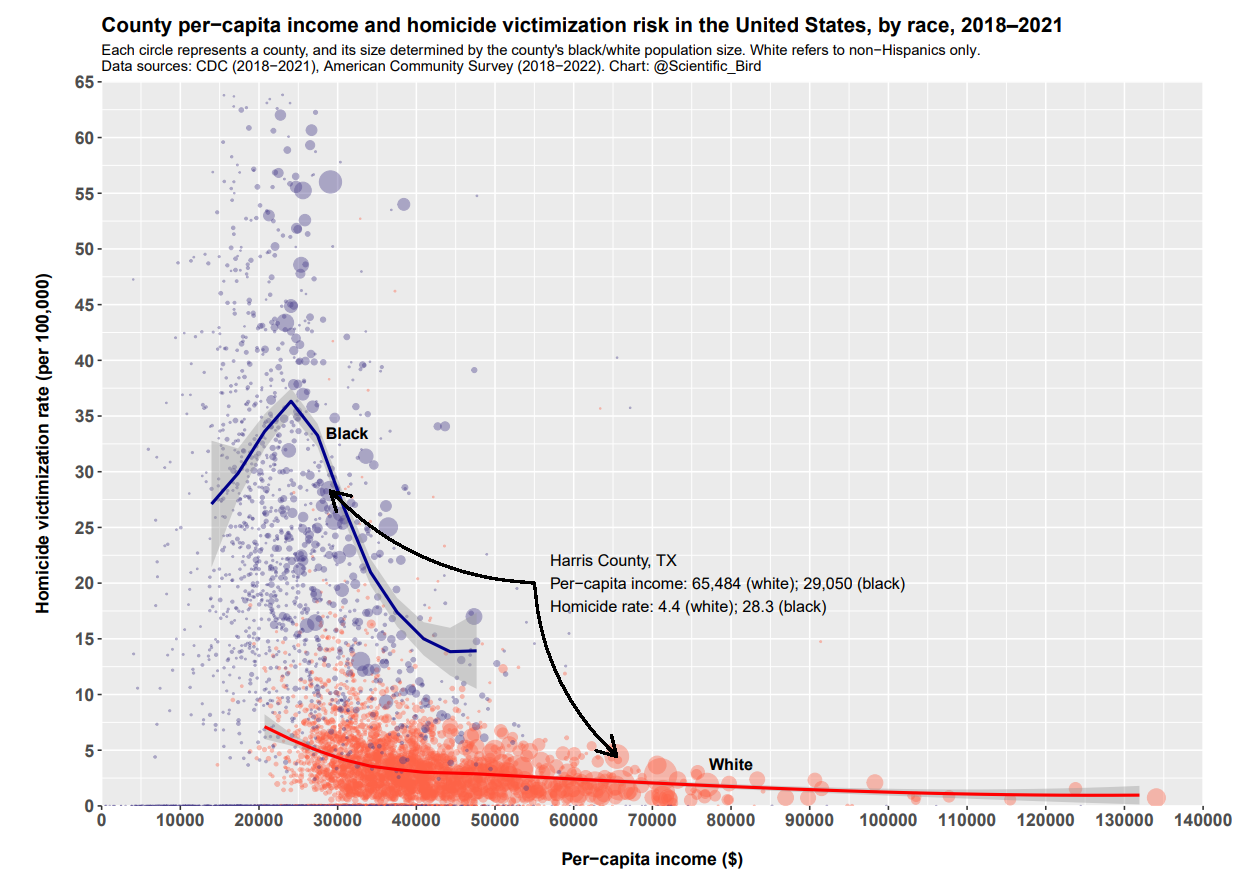
But how does this relate to economic disparities? The relationship between county per-capita income and within-county homicide victimization rate (both by race) is illustrated below:
A few things are immediately evident. Black people (blue) have higher homicide rates, but they also have lower incomes than white people (red). As I noted previously, economic disparities do not disappear within counties. For example, in Harris County, Texas (marked with arrows), white and black people have per-capita incomes of $65,484 and $29,050, respectively; and homicide victimization rates of 4.4 per 100,000 and 28.3 per 100,000, respectively.
The figure also answers our initial question: at any level of income for which there is overlap, the average black homicide victimization rate is substantially higher. Thus, the homicide rate really is higher even when income is controlled for.
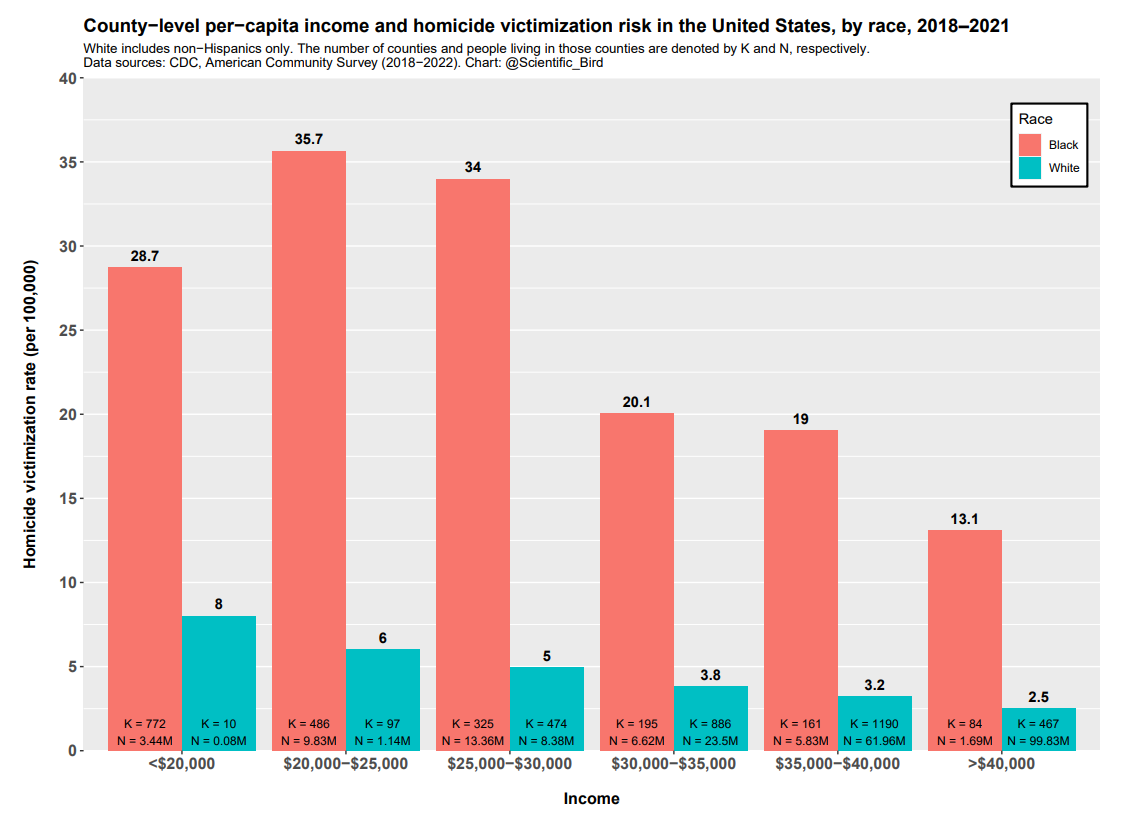
It is easier to visualize with income bins. This can be seen below:
For example, the last two bars illustrate that, in the counties where black people have per-capita incomes exceeding $40,000, black people in those counties have a homicide victimization risk of 13.1 per 100,000. Similarly, in the counties where white people have per-capita incomes exceeding $40,000, white people in those counties have a homicide victimization risk of 2.5 per 100,000.
Overall, the homicide disparities are very large. Within similar economic brackets, black individuals typically have multiple times higher homicide victimization risk than white individuals. More economically well-off black people even have higher homicide victimization risk than whites in the poorest bracket.
Other socioeconomic variables
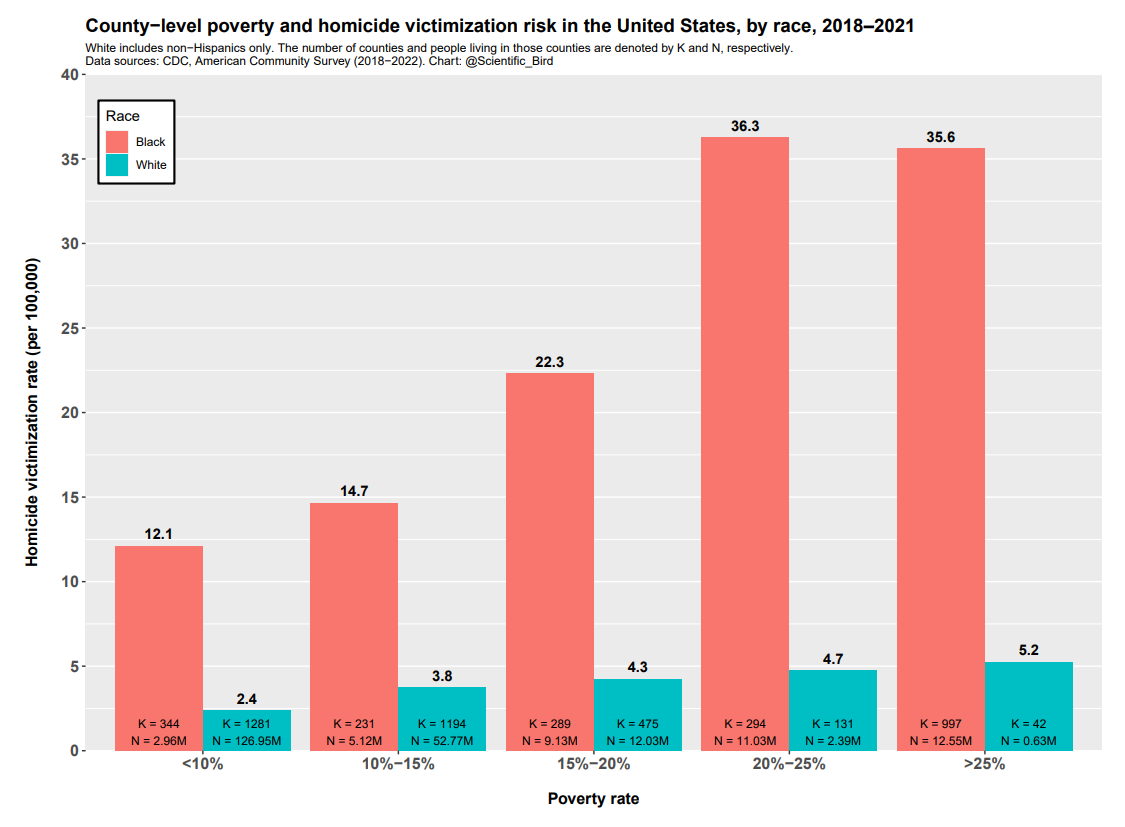
For completeness, I also tested other socioeconomic variables. Other than (1) per-capita income, I repeated the analysis for (2) median household income, (3) poverty rate, (4) male labor market participation rate, (5) educational attainment, and (6) a composite SES measure based on all the 5 previous variables. Nothing of consequence changed, the results being very similar in all cases. The following figure, for example, illustrates the relationship of homicide risk with county poverty rate (which had the greatest explanatory power).
Again, black people have markedly higher homicide victimization rates than white people in the same poverty rate bin, and even higher than white people in poorer bins.
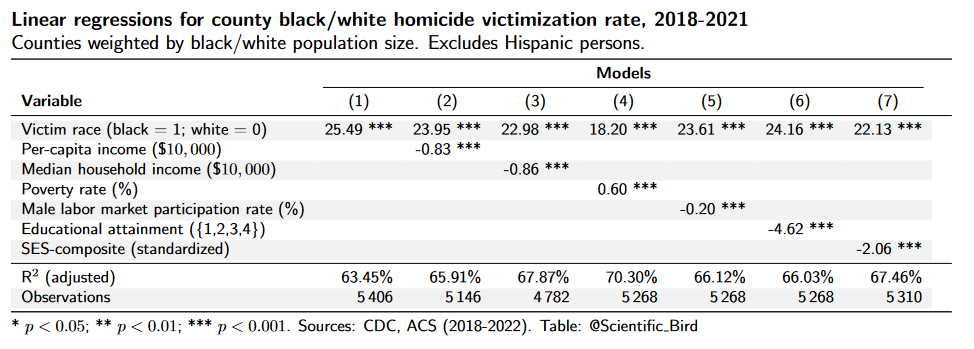
The following table illustrates regression results for the various socioeconomic indicators:
The table should be interpreted as follows. Model (1), where victim race is the only included variable, explains 63% of the county-wide variation in black/white homicide victimization rates. Moreover, the effect associated with black race is 25.49, meaning that black people have 25.49 more homicide victims per 100,000 individuals per year. This is essentially just restating that black and white people differ nationally in homicide victimization rate by approximately that much (28.3 vs 2.9). But model (4), for example, illustrates that adjusting for poverty rate lowers the race coefficient somewhat: from 25.49 to 18.20 (a 29% reduction). That is, the national black homicide victimization rate is about 7 times as large as the white homicide victimization rate even when poverty is accounted for [(18.20+2.9)/2.9]. Further, a 1% increase in poverty rate is associated with a 0.6 more homicides per 100,000. The regression results confirm that the race disparity remains statistically significant and substantial once any of the economic indicators are adjusted for.
Hispanics and Asians
While the focus is on the black-white disparity, it is worth briefly mentioning the two other large groups in the United States: Hispanics and Asians.
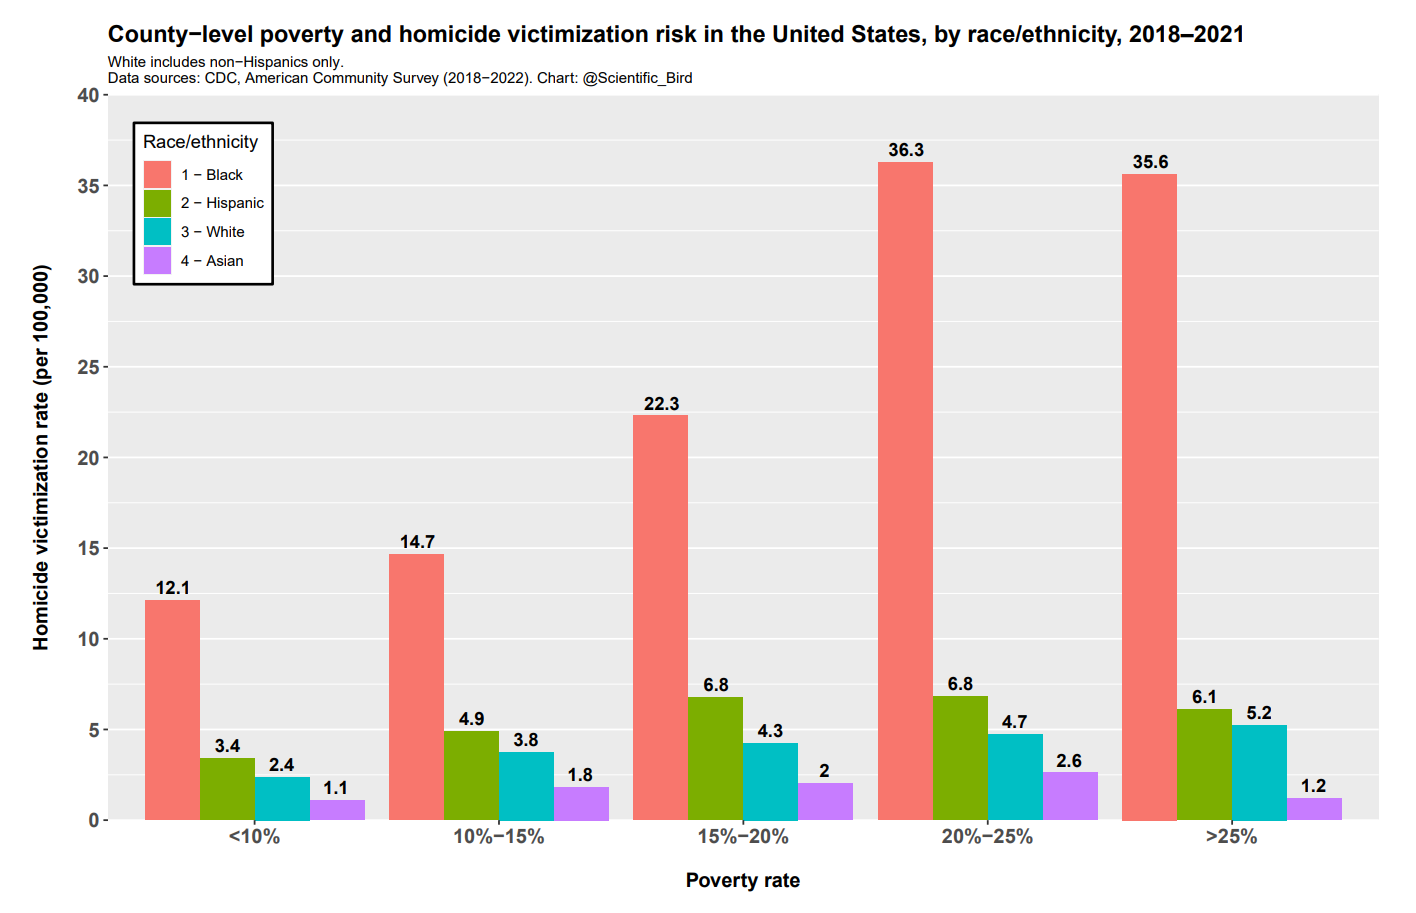
Hispanics are about as overrepresented among the poor as black people, but their homicide rates are still very different. And, while Hispanics nationally have about twice as high homicide victimization rate as non-Hispanic whites (5.9 vs 2.9 in the period 2018-2021), the disparity becomes fairly small when we adjust for poverty.
Asians have substantially lower homicide victimization rate than any of the three other groups, and this remains true when economic differences are adjusted for. This is shown below:
In counties where black people have poverty rates below 10%, black people die from homicide at the rate of 12.1 per 100,000. In counties where (non-Hispanic) white people have poverty rates below 10%, white people die from homicide at the rate of just 2.4 per 100,000. For Hispanics and Asians, the numbers are 3.4 and 1.1, respectively.
Discussion
Victimization vs. offending
You have probably noticed that I have used victimization data, not offending data. There is good reason for that: victimization data is uniquely comprehensive and reliable, as the CDC tracks all nationwide deaths and their causes (including homicide). While the victim can easily be demographically identified, the offender is often not known, leading to (potentially biased) missing information. Importantly for our purpose, the great majority of black/white homicides are intraracial; therefore victimization rates also serve as good proxies for offending rates.
However, it is still worth discussing what would change if we had access to perfect offending data instead of victimization data. Would the conclusion change? Qualitatively, no. Quantitatively, the homicide disparities would become larger, not smaller.
The existence of interracial homicides is why victimization rates are not perfect proxies for offending rates. If the number of interracial homicides is not symmetric (e.g., equal number of X-on-Y as Y-on-X), it biases the proxy as an estimator of offending rates. For several decades, it has consistently been found that there are more black-on-white homicides than there are white-on-black. This is to be expected, as there is typically more bleed-over from groups with higher offending rates to those with lower offending rates than vice versa. The same is also true for between-sex homicides, for instance.
The consequence is that the black offending rate is a bit higher than the black victimization rate, and the white offending rate is a bit lower than the white victimization rate. Therefore, homicide offending disparities would be somewhat larger than the victimization disparities seen in this analysis.
Poverty as a cause of homicide
In the regression model, about 29% of the black-white homicide disparity was statistically “accounted for” by controlling for differences in poverty rate. Does this mean that 29% of the homicide disparity would disappear if you magically eliminated the poverty gap? No. How big the reduction is depends on how much of the association is due to the causal effect of poverty on homicide propensity.
There are three reasons why poverty might be associated with homicide rates. First, if poverty causes an increase in violent crime rates (causal). The extent to which this is the case determines how much the gap would be reduced. Second, if crime causes an increase in poverty (reverse causal). Third, if common causes are responsible for both poverty and violence (confounding/selection). These are not mutually exclusive explanations and can all simultaneously play a role. But if all three explanations play a nontrivial role, and the causal story isn’t the whole story, significantly less than 29% of the homicide disparity would disappear if poverty disparities were eliminated.
Selection plays a major role (and probably the most important role) in producing the association between poverty and violent crime, as it does elsewhere. This means that various characteristics — personality, intelligence, antisocial behavior, mental disorders, and others — influence both poverty and crime risk. As a consequence, poverty and crime become clustered together. However, I don’t intend for this piece to be a thorough discussion about the causal nature of poverty; it is outside its scope. I flesh out these points in much greater detail in a different piece. It is safe to say that selection is important, and yet often ignored. For a relevant study, see, e.g., Sariaslan et al. (2021).
If selection and/or reverse causality play any meaningful role, and they surely do, it is arguably undesirable to even control for socioeconomic status. If they play the predominant role, controlling for socioeconomic status would lead you more astray than not controlling. That is to say, not controlling might give you a more accurate estimate of what would happen if poverty differences were eliminated than controlling for socioeconomic status would. This is because, when we “control for poverty”, we also indirectly control away characteristics that are selected into those environments, and not just the causal effect of poverty itself. This is counterintuitive to many, but it’s a well known fact of causal inference that controlling for variables can lead you to less accurate causal estimates (Rohrer, 2018). This does not mean that you should never control for variables, only that it should be done with careful consideration.3
Conclusion
I have analyzed to what extent poverty (and other socioeconomic indicators) can account for the black-white homicide disparity in the United States. Because of how poverty is distributed, we knew in advance that poverty couldn’t possibly account for the entire gap. Empirically, I have found that less than 30% of the black-white homicide victimization disparity is statistically “explained by” differences in poverty.
But this overstates how much the homicide offending gap would shrink if economic disparities magically vanished. First, due to patterns in interracial violence, we know that the homicide offending disparity is larger than the analyzed homicide victimization disparity. Second, and more importantly, the association between poverty and homicide is, at least in part, due to selection and reverse causality, instead of the causal effect of poverty on homicide propensity. Statistically controlling for poverty not only removes the thing we’re trying to isolate (the causal effect of poverty on homicide), but also overcontrols for selection and reverse causality. In summary, the causal effect of poverty explains only a small portion of the black-white homicide offending disparity.
That poverty cannot account for the black-white homicide disparity only tells you just that. It doesn’t tell us what the important causes actually are. People are free to propose other potential causes, and preferably justify them with compelling evidence. However, as this analysis shows, the popular conception that poverty is the entire or the predominant story of the black-white homicide disparity is incorrect.
In 2021, according to the FBI, 60% of homicide offenders with known race were black. In the same year, according to the CDC, 56% of homicide victims were black. Given known patterns in interracial crime, we know that homicide victimization represents a lower bound on homicide offending for black people. Therefore, at least 56% of homicide offenses were committed by black people in 2021.
For the economic variables, I use 2018-2022 ACS data on the geographical level of counties, with economic indicators split by race (black and non-Hispanic white). For homicide victimization, I use 2018-2021 CDC data, also on the geographical level of counties and split by race (black and non-Hispanic white).
This is also why I gladly controlled for both age and sex in my analysis of crime rates among immigration groups. Whereas I urge caution about interpreting results that are controlled for socioeconomi status. The issue is that, unlike with age or sex, personal behavior affects socioeconomic status and crime, so common causes can affect both socioeconomic status and crime.


Compelling analysis. This is a phenomenon that is fairly taboo, but screams for attention.
https://carolinacurmudgeon.substack.com/p/that-which-it-would-be-impolite-to
Great write up, thank you for sharing this. I had seen arguments that the US murder rate looks a lot like other Western countries once one controls for race, but this does a very good job of highlighting just what is going on there.