Out-of-Europe: History of Migrations to the United States
Following the Renaissance period, a transition started occurring in West Europe, with rapid advancements in science and technology happening in the 1400s. With improvements in cartography, ship and other maritime technology, and an increased desire to understand and discover everything, Europe set out to explore the world.
Most famously, Columbus’s voyages (1492–1504) led to the discovery of the Caribbean islands and Central America. Extensive exploration of mainland Americas would begin in the following decades, initially with Mediterranean countries (Spain, Portugal, Italy) at the forefront. But Dutch and English explorers would soon follow suit.
The first European children born in what is now the United States were born in the latter half of the 16th century1, and the 1580s saw the first attempt at permanent English settlement in North America. But colonization of what today is the United States started only in earnest in 1607 with the first permanent English settlement, Jamestown, on the eastern coast of Virginia.
Using a database of notable people by Laouenan et al. (2022), we can identify the origins of a large sample of European-born people who died in North America, a proxy for Trans-Atlantic migration. The birth places of these people are shown below.
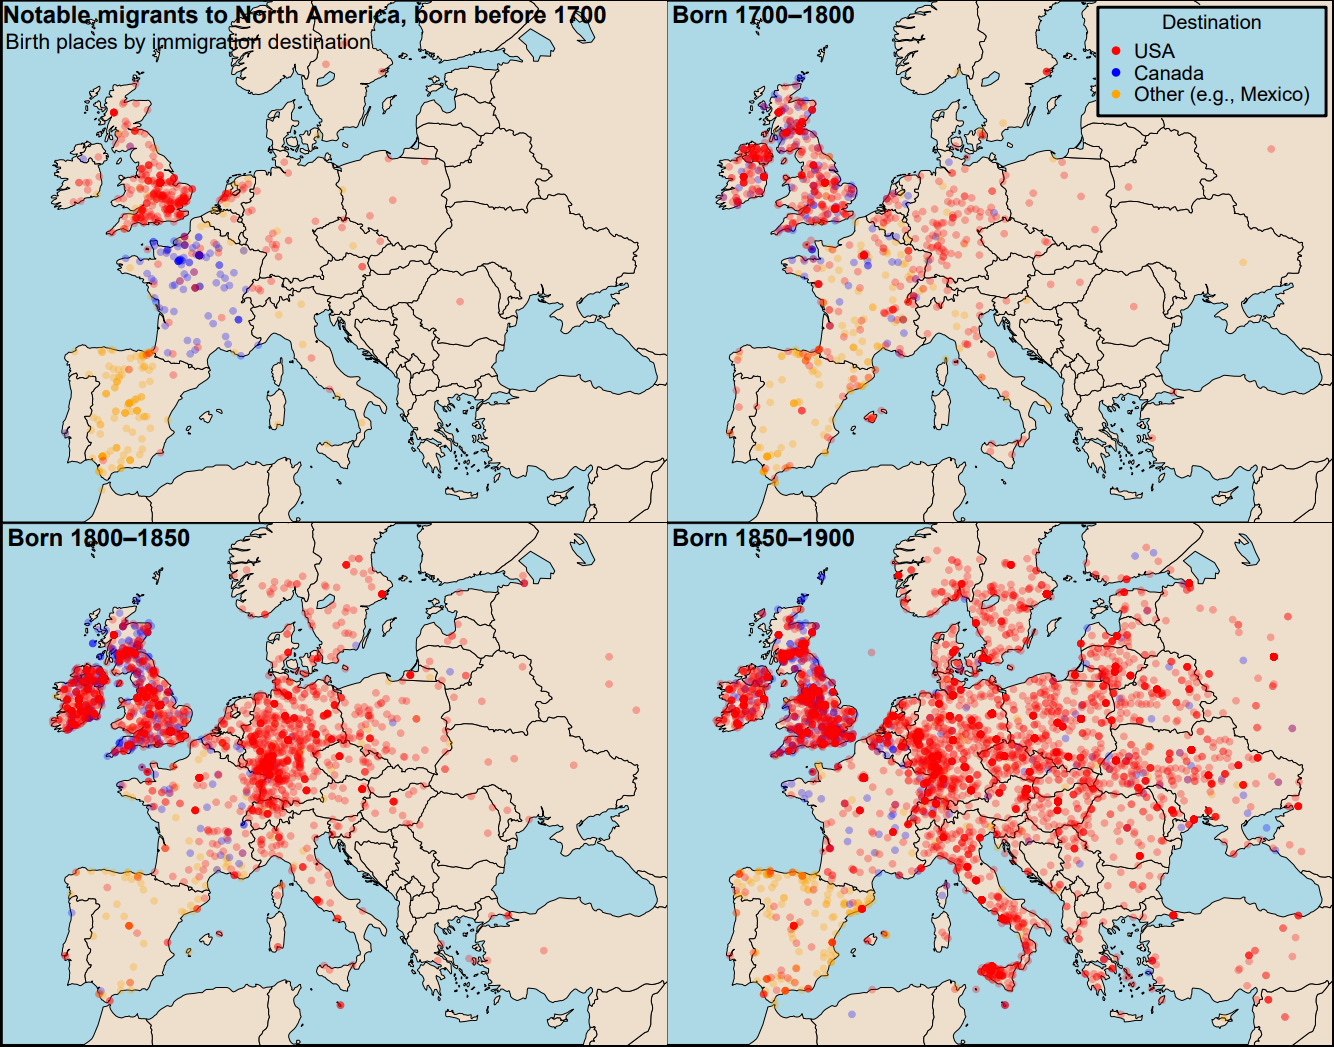
The early period (people born before 1700) shows that early French settlers ended up in Canada (blue), Spanish people mostly in Mexico (orange), and English settlers ended up in the United States (red). There were also smaller groups of early Dutch and German immigrants to the United States. In fact, the Dutch established “New Amsterdam,” which would later become New York City.
Except for the early French Canadian settlers, France is striking for its low number of emigrants. It is generally believed that this is because France was the first European country in which fertility greatly dropped and as a result its population growth largely stagnated. The intense population growth felt outside France created strong demographic pressures towards emigration.
The destinations of immigrants (proxied by death coordinates) are illustrated below. Again, we see Spanish (orange) people scattered across Mexico and the rest of Mesoamerica. We see the clear beginnings of French Canada (blue). And lastly we see European immigrants spreading across the United States.
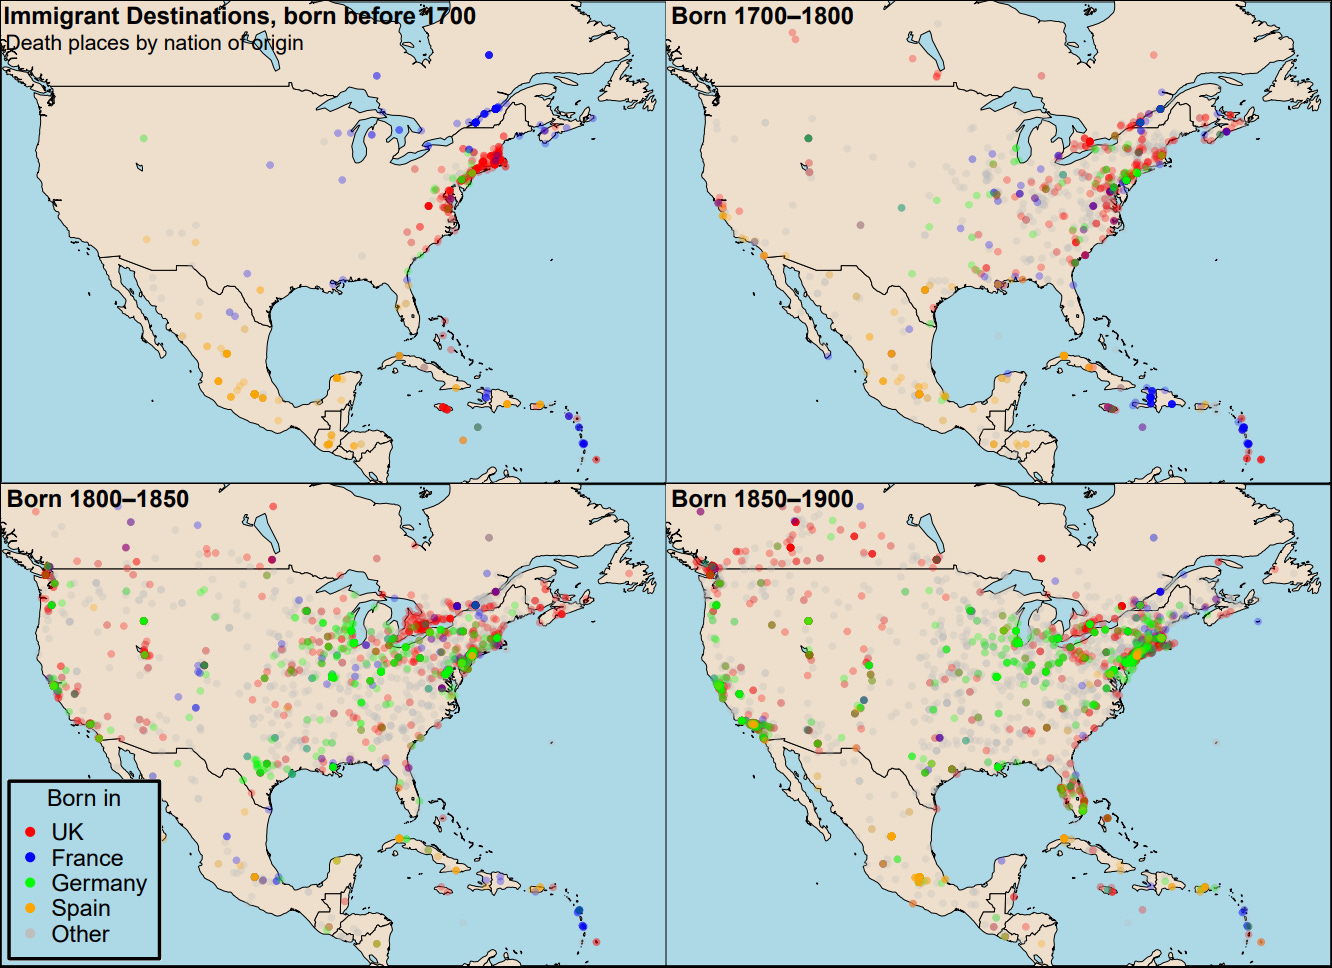
In the centuries after the establishment of the first colonies, large numbers of Europeans would migrate to the Americas. In 1790, the white population in America consisted approximately of 85.6% from the British Isles (59.7% English, 4.3% Welsh, 10.5% Scotch-Irish, 5.3% Scottish, 5.8% Irish), 8.9% German, 3.1% Dutch, 2.1% French and 0.3% Swedish (Purvis, 1984).
But not all were white. When we speak of mass migrations, the forced transportation of black African slaves during the Trans-Atlantic slave trade should also be mentioned. The great majority were sent to the Caribbean and South America. But during the entire trade, according to the Trans-Atlantic Slave Trade Database, an estimated 366,183 slaves were transported to mainland North America. While a tiny fraction of the overall trade (3.7% out of estimated 10,004,748 slaves), black people today make up about 13% of the population in the United States. Slaves brought to the US were generally of Nigerian, Coastal West African or Congolese ancestry (Micheletti et al., 2020). Most were brought to the Southern States, where black Americans remain most numerous to this day.
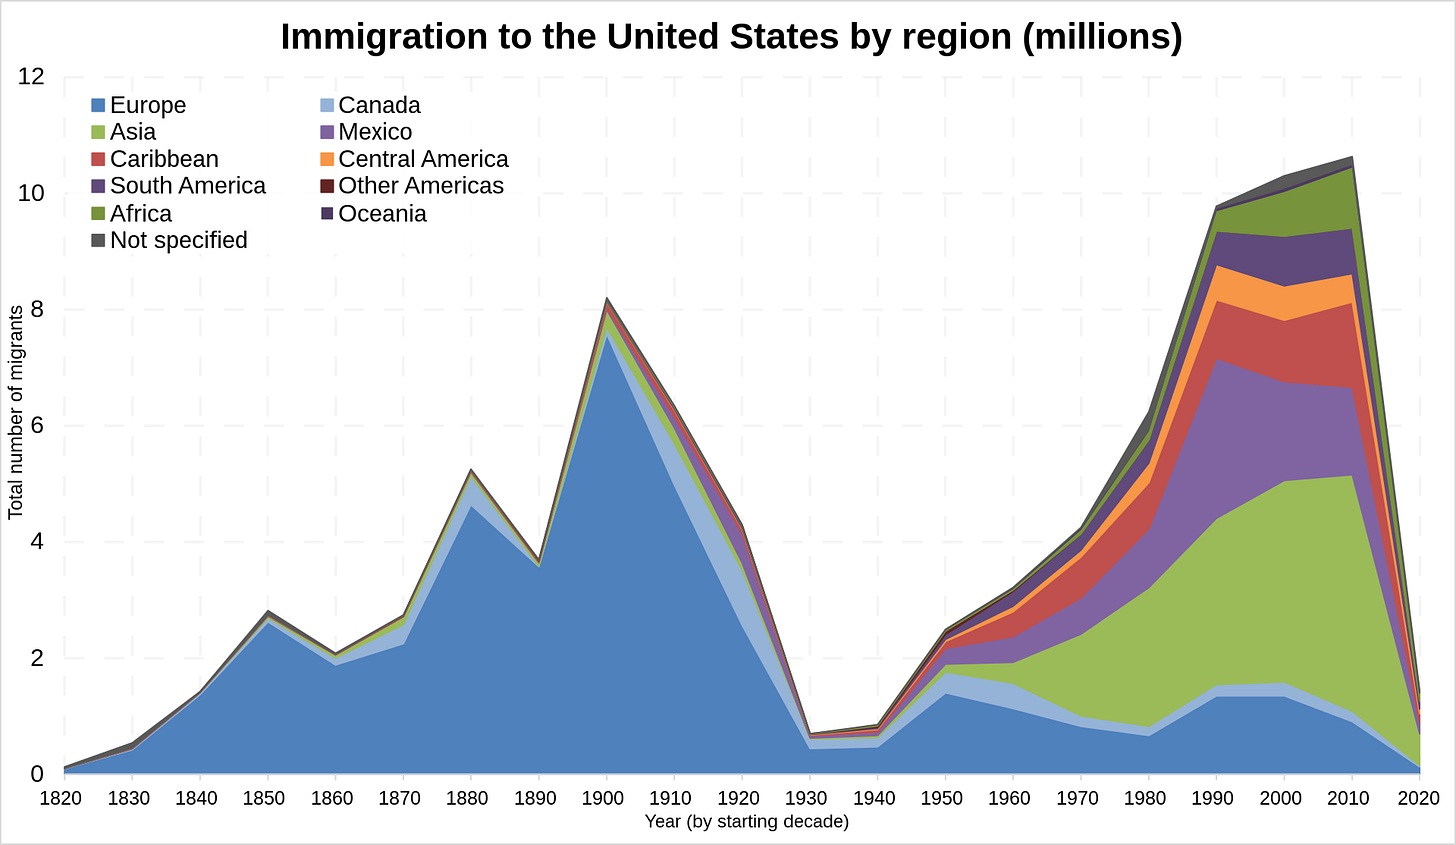
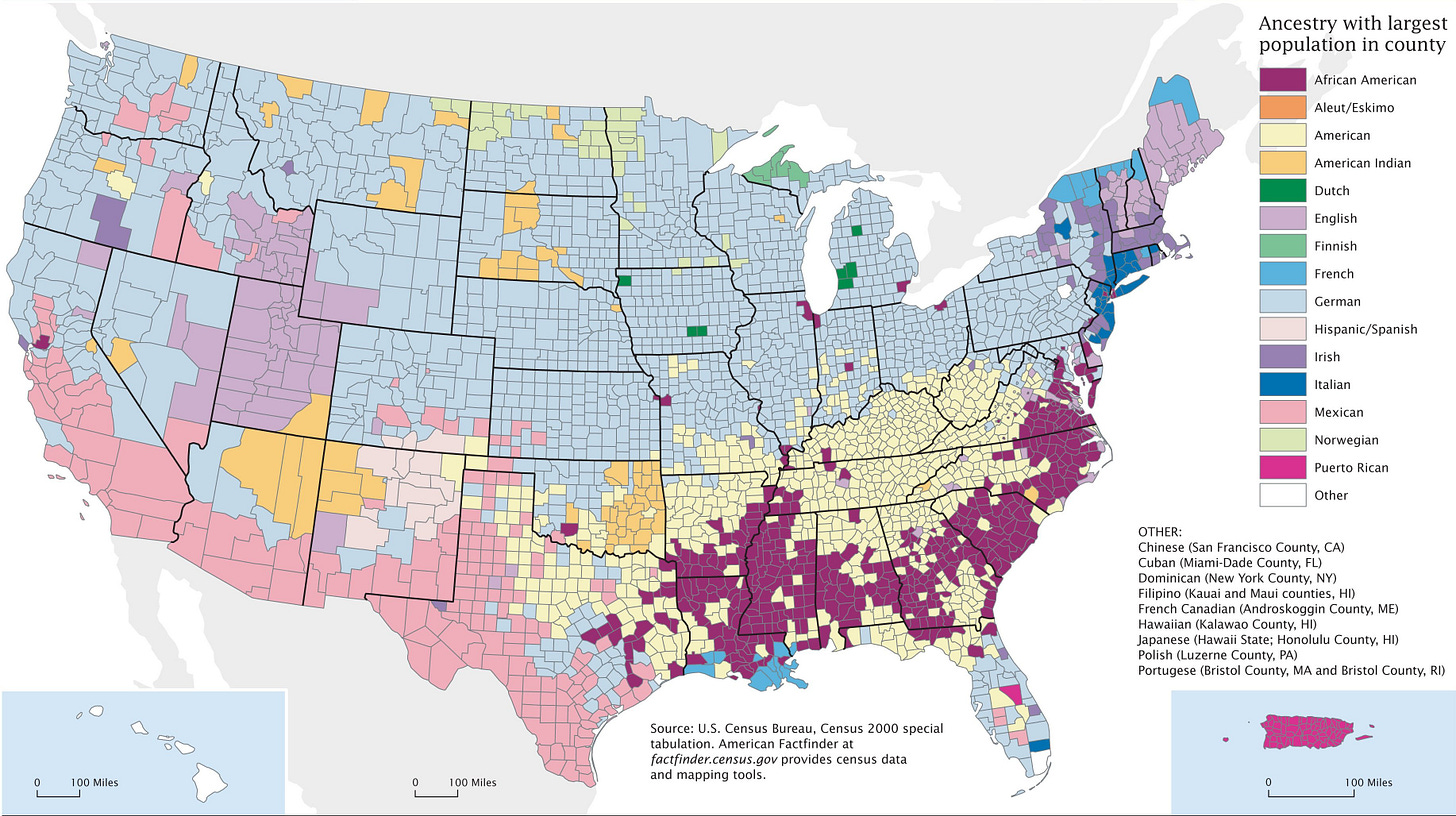
European immigration rose to unprecedented heights during the Age of Mass Migration (1850–1930) where >40 million Europeans moved to the New World, and roughly 30 million moved to the United States. Non-British immigrant groups also became very large in this period. German immigrants were especially numerous, and German ancestry is the largest self-reported ancestry group today (British ancestry is possibly moderately underestimated from self-reports, however).2
The number of immigrants from 1820 and beyond can be seen below, which includes the Age of Mass Migration and the post-war migration periods.
Owing to mass migration, combined with the very high fertility rates of the past, North America experienced enormous population growth. While initially confined to the small area on the east coast, populations rapidly expanded inward and across the continent. Below I have shown notable people born in North America, illustrating the expansion over time. Based on surnames, I was also able to infer people's national ancestral origins.3
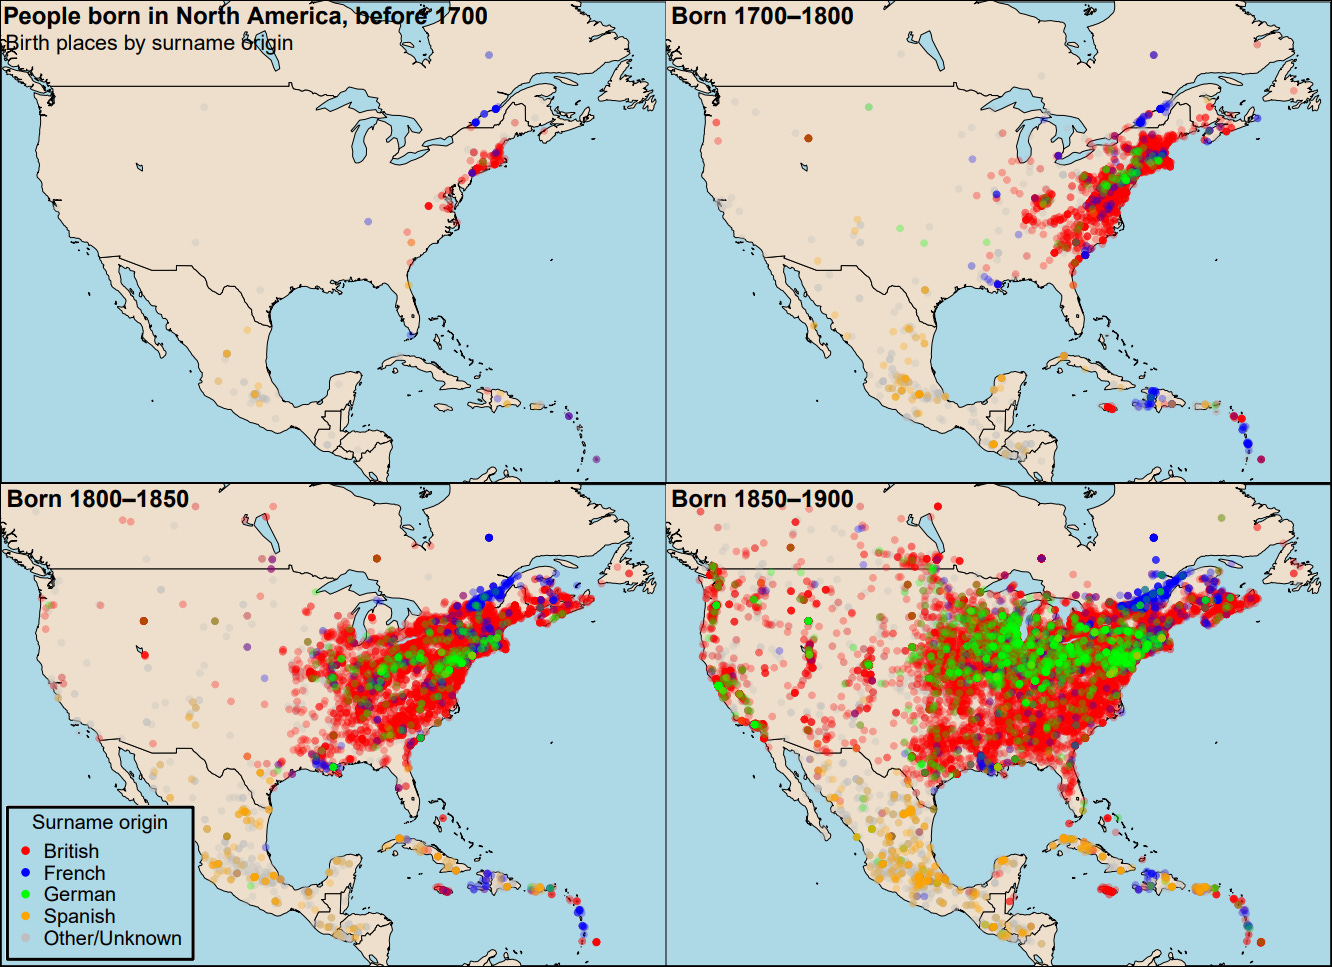
Many interesting aspects of American history are illustrated in all these previous figures: The historical expansion of peoples across America; the distinctions between English, French and Spanish colonies; which nations owned which Caribbean colonies; the different waves of immigration from different places, such as Sicilian emigration of the late 19th and early 20th centuries; etc.
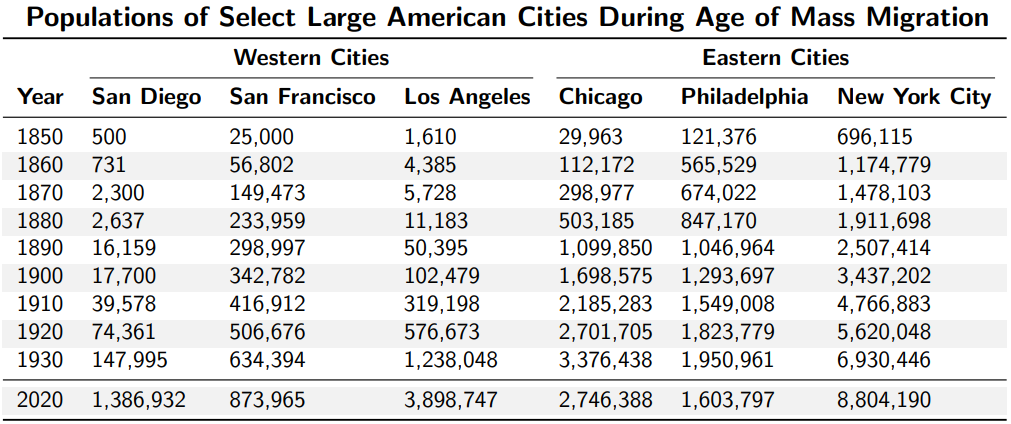
They also illustrate how recently the west coast became populated. Another way to show this is by comparing populations of today’s large western and eastern cities. For example, between 1850 and 1900, the population of Los Angeles grew from just 1,610 to 102,000. But in 1900, eastern cities such as Chicago, Philadelphia and New York City each had populations of well over 1 million.
After WW2, a new wave of immigration from war-torn Europe began. And after the 1965 Immigration Act, immigration was no longer near-exclusively European. Large waves of immigration began from regions near the United States, such as Latin America (particularly the neighbor, Mexico) and the Caribbean islands. Asian immigrants became numerous as well, following the aftermath of several wars (Korean War, Vietnam War, Laotian and Cambodian civil wars).
Many highly notable individuals in history were immigrants in America. Businessmen, industrialists and ultra-wealthy individuals like John Jacob Astor and Andrew Carnegie. Figures in science such as Joseph Priestley, Nikola Tesla, Albert Einstein, and several Nobel prize laureates. Cultural figures such as Russian composer Sergei Rachmaninoff, escape artist and entertainer Harry Houdini, and Dracula actor Bela Lugosi. And many more.
The American immigration history gives context to the modern ancestry distribution in America. The following figure displays the largest self-reported ancestry group in each 3000+ counties in the United States in the year 2000.
Immigrant outcomes, characteristics and consequences
Despite their huge numbers, immigration was still (self-)selective—they were not randomly chosen from the population of the sending countries. For example, some studies have documented that, in the Age of Mass Migration, immigrants heading to the United States were particularly individualistic (Knudsen, 2022; Bazzi et al., 2020).4
A large share of migrants also returned to their home countries. Aggregate estimates are commonly given between 25 and 40%, with variation between countries and contexts, and serious estimates as high as 60-75% exist (Bandiera et al., 2013). This process was also not random. Evidence shows that return migration was negatively selected (Abramitzky et al., 2019). In other words, less skilled and less economically successful migrants were more likely to return to their home countries.
The previously mentioned facts hint that common narratives of European mass assimilation — the “melting pot” — may be overstated. It is inevitable that immigrants will partially assimilate, as it is inevitable that society partially assimilates to them (that is, immigrants influence the trajectory of their destination country5). But it would be a mistake to ignore that a large fraction of unsuccessful immigrants did not “assimilate” — they left. More importantly, among those who did remain, disparities have far from fully converged (“melted together”).
While racial economic disparities are more conspicuous and give rise to more political controversy, substantial economic disparities between European ethnic groups are just as real. And these gaps are not merely a recent creation. In the Age of Mass Migration, successful migrant groups to the United States tended to be successful in the following generations (Ward, 2020; Abramitzky et al., 2014). This mirrors a large body of literature revealing that, when properly measured and tracked, social status is highly persistent across many generations (see, e.g., Clark, 2014; Ward, 2021). It has also been shown that, between 1850 and 2010, county GDP per-capita was related to the nation-of-origin composition. American counties with higher shares of people from more well-off countries tended to have higher GDP per-capita (Fulford et al., 2018).6 This in turn mirrors a large literature on the deep roots of economic development (see, e.g., Spolaore & Wacziarg, 2013).7 Together these strands of evidence converge on a similar conclusion. When people migrate they tend to bring their economic conditions with them, and relative social standing has a high degree of persistence across generations.
Economic disparities between immigrant groups likely reflect mainly differences in skills. Skill differences between immigrant groups exist due to a combination of (1) extant average skill differences between origin-country populations, and (2) differences in how immigrants are drawn from their respective populations (i.e., differences in immigration selectivity). There is much evidence to substantiate the importance of the former (De Philippis & Rossi, 2021; Carabaña, 2011; Rindermann & Thompson, 2016; Slichter et al., 2021), and entry wage differences between various immigrant groups are statistically related to the wealth of the sending country (see below).
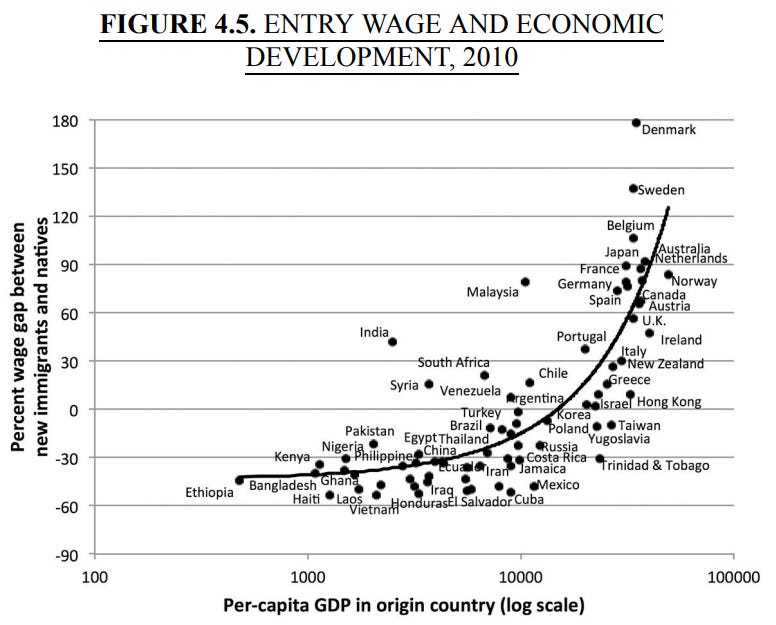
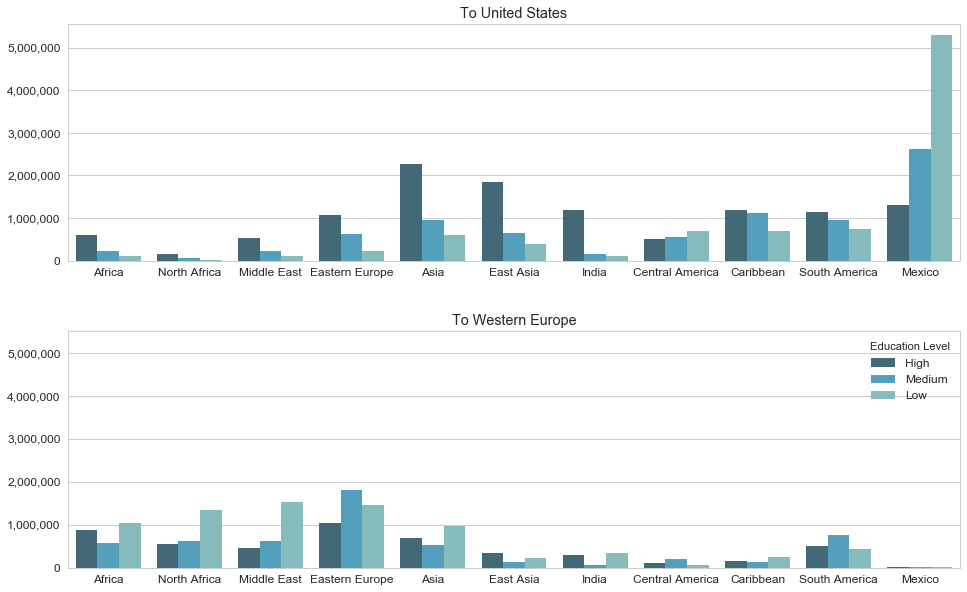
Where immigrant groups deviate substantially from the trend line (e.g., India), this likely largely reflects immigrant selectivity. For example, modern Indian immigrants in the United States are known to be extremely positively selected.8 On the other end, Latin American immigrants (below the trend line) tend to be less positively selected.9 To illustrate this, consider the following figure of immigrant educational levels, juxtaposing immigrants to the United States and West Europe in 2010. Indian immigrants arriving in the United States are nearly all highly educated, which is not the case for, e.g., Mexican immigrants.
There is direct evidence speaking to the importance of immigrant selectivity in the modern American context (Feliciano, 2005; Duncan & Trejo, 2015), but such findings have also repeatedly been replicated in other countries where it has been investigated (Werfhorst & Heath, 2018; Ichou, 2014). The importance of immigration selectivity as it pertains to immigrant economic success is seen below.
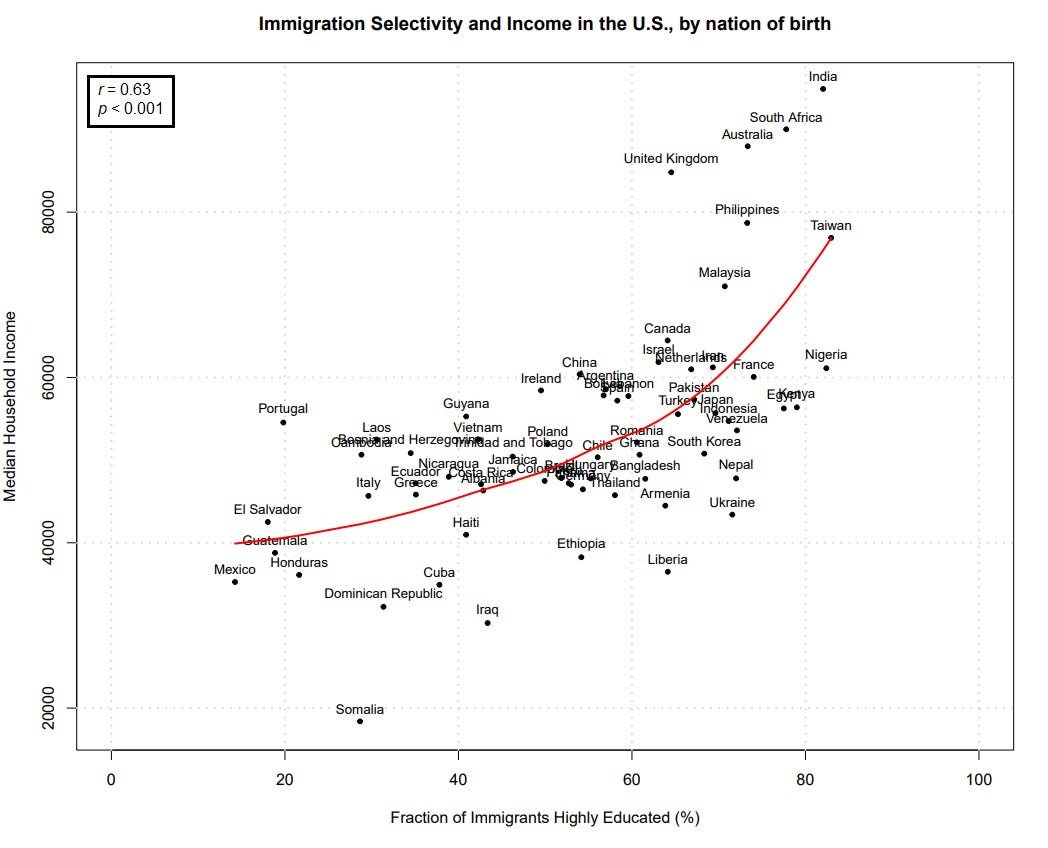
Both selectivity and country-of-origin characteristics are clearly important, and when considered simultaneously together, even more of the differences can be statistically explained.10
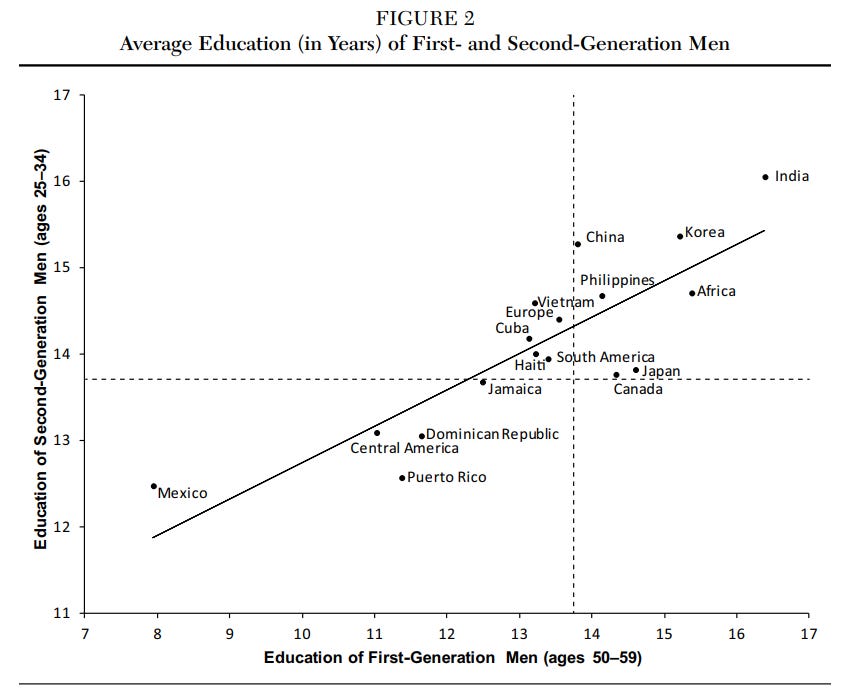
The differences in relative pre-migration skills, education or incomes among immigrants are generally reproduced in the subsequent generations. As an example, the intergenerational transmission of educational attainment among immigrant groups is illustrated below.11
To further analyze differences between immigrants in history, I returned to the notable people database and looked at the occupations of notable immigrants. For immigrants born 1900–1950, the occupational distribution by nation of origin is shown below.
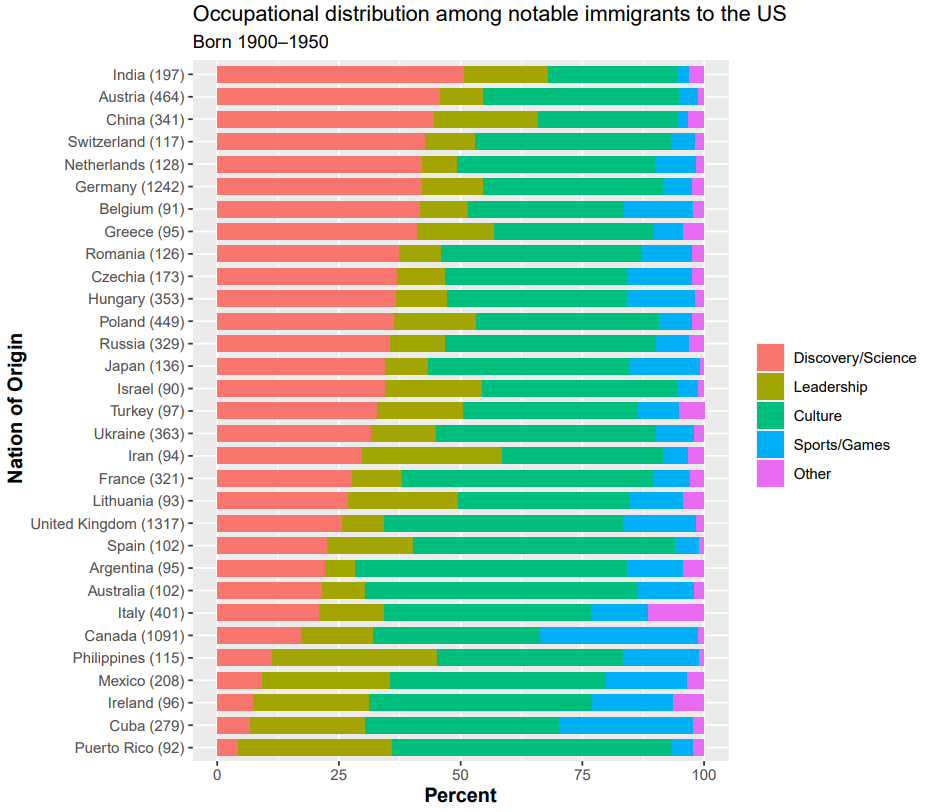
There are robust differences between some of the immigrant groups. Of particular note is the large difference in fraction who are notable in the scientific realm (versus notable in other occupations) between the top and bottom groups. Immigrant groups with highest proportion notable for science include some European countries (e.g., Austria, Switzerland, Netherlands, Germany and Belgium)12, but also Asian countries such as India and China.13 On the lower end, Latin American immigrant groups (Mexico, Puerto Rico, Cuba) and the Irish14 are underrepresented in notability for science.
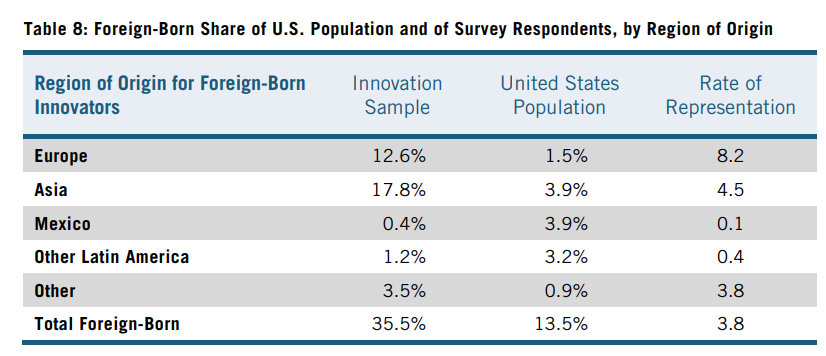
These results are broadly in line with other analyses of (mainly STEM) innovation in present-day United States. Taken as a whole, immigrants are known to be overrepresented among innovators in the United States (Fink & Miguelez, 2013), but Nager et al. (2016) find more specifically that European and Asian (including Indian) immigrant groups are overrepresented among innovators, whereas Latin American immigrant groups are underrepresented. Together this fits with previously discussed facts. The overrepresentation of innovation among immigrants is likely the result of high-skilled immigration, and less positively selected immigrants are not overrepresented among innovators.
Clark (2014) considered group eliteness in modern United States by the group’s relative representation among doctors (a fairly high status occupation). The illustration below shows this for the elite groups exceeding the Irish rate (who are approximately at the national average).
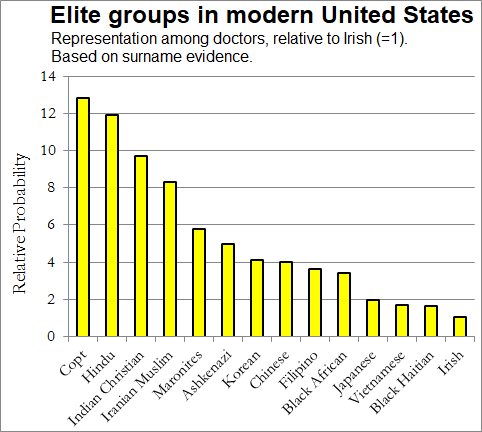
Among the “underclasses”, groups which had relative representation of 0.5 or lower, were Cambodian, Latino, (American) Black, Hmong, Maya, and Native American (Clark, 2014, chapter 13). These are more detailed than national categories, but many similarities can be found. For example, Hindus (Indians) and Chinese among the elites, and Latinos among the underrepresented.
Conclusion
America has long been center of innovation. The Industrial Revolution may have begun in Great Britain, but it spread to and was expanded upon in America. By the turn of the 20th century, it was the richest nation on the planet. Its unusual immigration history has likely been an important economic contributor. As a magnet for entrepreneurs and innovators, several immigrants in America have become extraordinarily wealthy: today’s Elon Musk is yesterday’s John Jacob Astor.15 However, the effects of immigration clearly depend on who is arriving. As American history shows, even European immigrant groups differed between each other, and such differences did not quickly vanish.
The American immigration history provides plenty examples of what I’ll cheekily call the first three “laws” of immigration:
Immigrant selection: Immigrants differ from their origin population.
Immigrant heterogeneity: Immigrant groups differ from one another.
Intergenerational persistence: Complete assimilation is slow.
These simple statements are not just true but also practically relevant, e.g., for economic disparities between immigrants. Not only American history is aided by understanding this, as are patterns in immigration elsewhere better understood when these are kept in mind. Questions such as why Mexican immigrants perform better in West Europe than in America, and why the opposite is the case for Arab immigrants, and many others, are more easily understood once immigrant selection is considered.
The Spanish Martín de Argüelles (b. 1566) is sometimes referred to as “the first white child” for supposedly being the first European child born in the United States, more precisely in Florida. Virginia Dare (b. 1587) was the first English child born in a New World English colony.
German ancestry is in fact the most commonly self-reported ancestry in the United States today. However, British ancestry is possibly moderately underestimated from self-reports, as many of them appear to simply report “American” ancestry. In the 1980 census — before the “American” ancestry category option was added — English was the largest self-reported ancestry group (50 million), followed by German (49 million). Additionally from the Anglosphere were self-reported Irish ancestry (40 million) and Scottish (10 million). Further, a study assessing genetic ancestry in the U.S. found that self-reported “American” ancestry is particularly common in states with high levels of British ancestry as inferred from genomes. They write: “Inferred British/Irish ancestry is found in European Americans from all states at mean proportions of more than 20% and represents a majority of ancestry (more than 50% mean proportion) in states such as Mississippi, Arkansas, and Tennessee. These states are similarly highlighted in the map of the self-reported “American” ethnicity in the US 2010 Census survey” (Bryc et al., 2015).
The database stores nothing like “ethnicity” or “ancestry.” While birth nation is stored, this is not helpful to identify ancestral origins of descendants who, by definition, are born in the United States. Instead, by systematically searching the entire database and finding surnames that clustered disproportionately in certain countries, I was able to infer national ancestral origins of people who were even born outside those countries.
Knudsen measures “individualism” with a few different proxies. First, by the proportion of individuals who are given common versus rarer first names (which has been shown to be related to various other measures of conformism/individualism within countries). Second, by the tendency to live in extended family structures. Third, by whether they marry someone of the same local origin. However, Knudsen also notes that the so-called “individualists” were also more likely to do skilled work, hold assets, and not rely on poor relief. This would suggests that, in effect, it was also skill-selected immigration.
The economist Garett Jones calls such phenomena “culture transplants.” A recent study even showed that intra-American migrations of Southern whites brought along with them certain persistent cultural/political attitudes and shaped their surroundings (Bazzi et al., 2023).
Berger & Engzell (2019) also find that “US areas populated by descendants to European immigrants have similar levels of income equality and mobility as the countries their forebears came from”, which also illustrates a strong persistence of economic outcomes.
A study by Comin, Easterly and Gong (2010) is particularly illustrative. They show that national technological adoption in 1500 AD is strongly (but obviously far from perfectly) associated with modern national economic prosperity. Importantly, they show that the correlation is much stronger in migration-adjusted models. This is ultimately a demonstration that economic conditions are brought along by people wherever they go, which has a strong degree of persistence across centuries.
That Indian immigration is highly selective is demonstrated by the fact that Indian immigrants to the US have much higher educational attainment than the general Indian population. The Brain Drain data suggests that 82% of Indian immigrants to the US in 2010 had high education (more than high school education). But, in 2011 — around the same time as the 2010 Brain Drain data — the literacy rate in India was not even 82%, let alone the rate of completed post-secondary or tertiary education.
Feliciano (2005) provides evidence that Mexican immigration has been become less positively selective since the ‘60s.
The IAB Brain-drain dataset sorts immigrants’ level of education into 3 categories: low, medium and high. I used the fraction which were highly educated as one variable. For nation-of-origin variable, I used the 2010 GDP per-capita of origin countries of the Maddison Project. The median household incomes by nation of birth were derived from the American Community Survey (2010). Even these two relatively simple measures together explain almost half (46%) of variation in household incomes among immigrant groups. With more accurate, comprehensive and detailed measures of immigrant skills this would increase.
Note also that the high educational attainment among Indian immigrants persists across generations, and Indian immigrants to America have much higher educational attainment than the general population in India.
There are many European immigrants notable for science. Examples include the Dutch Peter Debye (b. 1884), Nobel laureate in Chemistry; the German Albert Einstein (b. 1879), Emmy Noether (b. 1882), Hans Bethe (b. 1906), among many others (Ernst Mayr, Rudolf Carnap, Hannah Arendt, etc); the Swedish inventor John Ericsson (b. 1803); Belgian Leo Baekeland (b. 1863); Greek Georgios Papanikolaou (b. 1883), inventor of the Pap smear; and French mathematician André Weil (b. 1906).
Chinese immigrants notable for science include Chien-Shiung Wu (b. 1912), a female particle physicist working on the Manhattan Project, and Daniel Chee Tsui (b. 1939), a physics Nobel laureate. Interestingly, two important scientists born in China were born to non-Chinese parents, and migrated to the United States. These are Walter H. Brattain (b. 1902), co-inventor of the point-contact transistor and physics Nobel laureate, and the political scientist Benedict Anderson (b. 1936). A few examples of notable Indian immigrants include Har Gobind Khorana (b. 1922), biochemist and Nobel laureate in medicine/physiology; theoretical physicist E. C. G. Sudarshan (b. 1931); and computer scientist Raj Reddy (b. 1937).
This may in part be related to negative selection among Irish immigrants (Connor, 2019). Indeed, Ireland had the largest share of their population emigrate among any European countries. Some of the notable Irish scientists who were immigrants in the US include the submarine engineer John Philip Holland (b. 1841), the computer engineer Kathleen Antonelli (b. 1921), and the historian Peter Brown (b. 1935).
John Jacob Astor (b. 1763), a German-born immigrant and businessman, who, mainly through the fur trade, became one of the richest people in modern history (relative to GDP). In the light of social status persistence, it should come as no surprise that several members of the Astor family were incredibly wealthy. In fact, even his great-grandson, John Jacob Astor IV (b. 1864), was also among the world’s richest people in his lifetime. Unfortunately, his wealth could not save him when he died as the richest passenger on the Titanic. Other than John Jacob Astor, a few American immigrants in history who were exceptionally rich include Stephen Girard (b. 1750), Alexander Stewart (b. 1803), William Weightman (b. 1813), Claus Spreckels (b. 1828), James Graham Fair (b. 1831), Friedrich Weyerhäuser (b. 1834), Andrew Carnegie (b. 1835), John Kluge (b. 1914).


Thorough overview.
The Ellis Island period has been covered by a lot of other authors in the past as well with similar conclusions. That experience doesn't provide any data that would indicate that low IQ immigration in the modern era would end the same as Catholics in 1875 or whatever. The cost of immigration were pretty high which kept out a lot of the riff riff, whereas it isn't that hard to cross the American border these days.
In general the period of European immigration (1848-1924) was very successful. Decent genetic stock with close enough racial and religious/cultural links to the native stock in a country in desperate need for labor to exploit its untapped land the resources. Still, it did cause growing pains (especially amongst organized crime and urban spoils systems) that had probably reached a limit by 1924. A generation break from such immigration to digest probably made sense.
The ability to assimilate non-WASP europeans was also crucial in the Norths advantage over the South, without those immigrants it would not have has as great an advantage in the Civil War. Germans fleeing 1848 in particular were repulsed by slavery.
The relationship between immigrant entry wages and the economic development of origin country as well as immigrant groups’ level of education and their median household income are more adequately described by the Threshold Model of formal-operative intelligence than by the quadratic model. In contrast to the purely statistical quadratic model, the threshold model has a plausible theoretical foundation. https://www.researchgate.net/publication/352043834_Non-Linearity_of_Intelligence_Effects_and_the_Threshold_Model_of_Formal-Operative_Intelligence