Crime in the USA
A short primer and collection of basic descriptive facts
If one wishes to understand the causes of American crime, first and foremost it is vital to get a solid foundation of the basic descriptive facts. Theorizing about underlying causes is far more likely to go astray when one begins with an inaccurate understanding of reality. Thus, the goal of this post is not to delve deeply into the etiology of crime or complicated multivariate analyses, but instead equip the reader with a collection of the most important facts.
I will focus primarily, though not exclusively, on the crime of homicide. The reason is twofold: (1) homicide is one of the most serious crimes and the societal burden of homicide is huge despite its relative rarity (see, e.g., Wickramasekera et al., 2015); (2) homicide data is far more reliable than for most other types of crime. This means that, even if you’re interested in a broader range of violent crimes, using homicide rates as proxy is generally advisable as it is more reliable.
This post has multiple sections, each of which can largely be read independently, and each (hopefully) providing insight into an important aspect of crime in America.
History of the American homicide rate
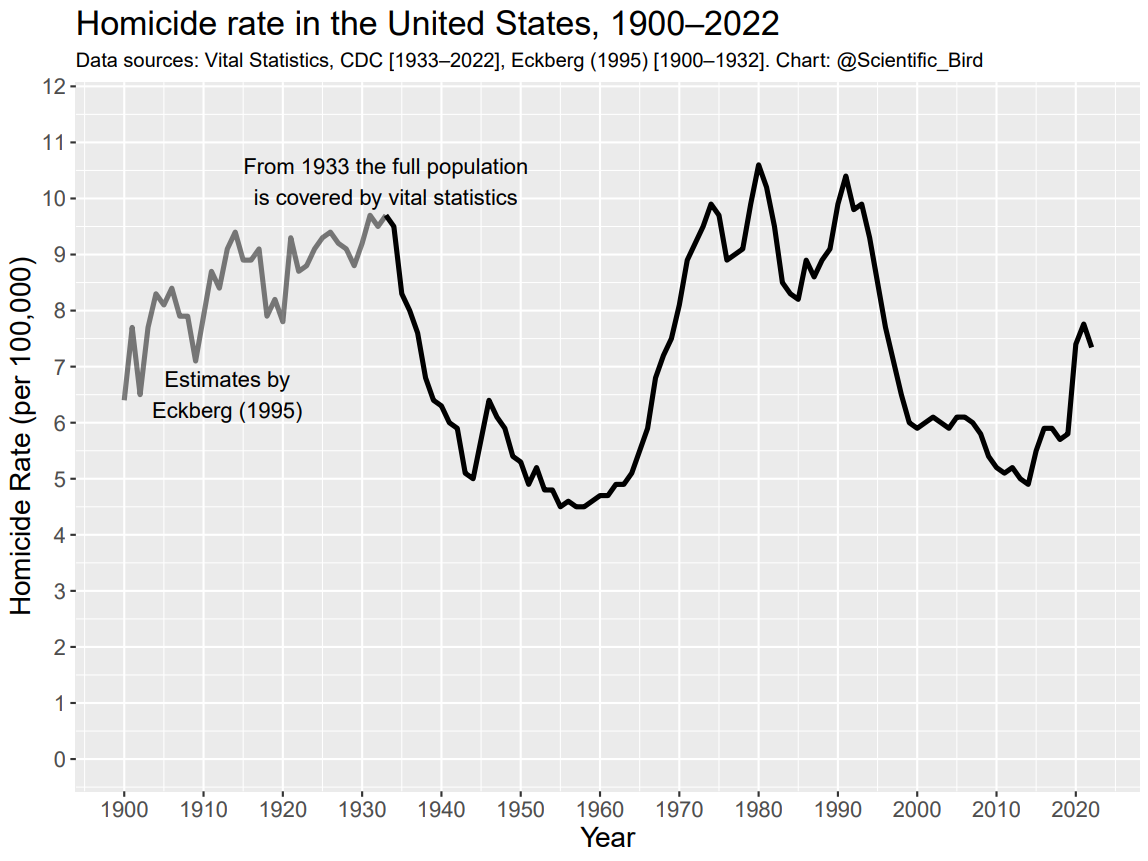
When analyzing crime rates, it is useful to first consider the historical perspective. The figure below illustrates the evolution of the American homicide rate between 1900 and 2022.1
If you had looked from just the ‘90s forward, or some other not too distant decade, you might be misled to believe that homicide rates have been on a constant downward trajectory, except for the recent spike. This long time series paints a very different picture.
Instead of any consistent directional trend, homicide rates have undergone large fluctuations in the last century. Modern homicide rates are not historically low, even prior to the 2020-spike. While the modern homicide rate remains well below that of the large peaks of the ‘70s through the ‘90s, the average homicide rate between 1943 and 1965 was lower than the average between 1999 and 2019. Even in 1900, the homicide rate was comparable to the present one and only moderately higher than the pre-2020 spike.
American homicide in the international context
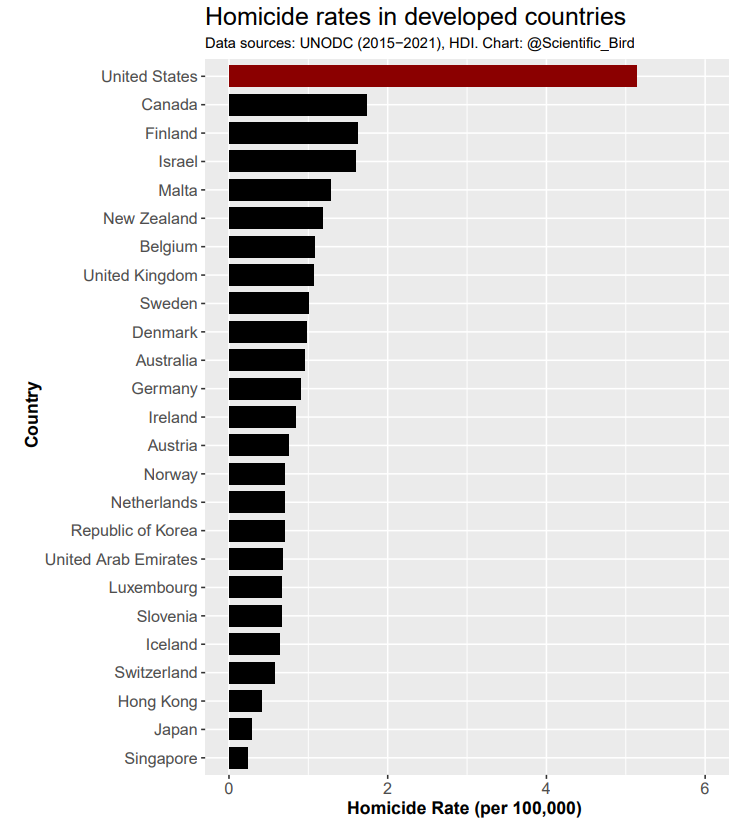
Just as the historical perspective is useful, so are international comparisons. It is no secret the American violent crime rate is an outlier among highly developed countries. The plot below ranks the 25 most highly developed nations by homicide rate2:
The United States homicide rate averaged 5.5 homicides per 100,000 across the 2015-2021 period, which was 6.4 times higher than the average of the remaining 24 countries of 0.86 per 100,000. The difference has grown even larger since 2020.
The United States is of course only exceptional when compared to other highly developed countries. For comparison, here is a list of countries which (according to the same source and period) had at least five times higher homicide rate: El Salvador (55.1 per 100k), Jamaica (49.0 per 100k), Honduras (43.2 per 100k), South Africa (36.0 per 100k), Trinidad and Tobago (31.3 per 100k), and Nigeria (27.7 per 100k).
Law enforcement in international context
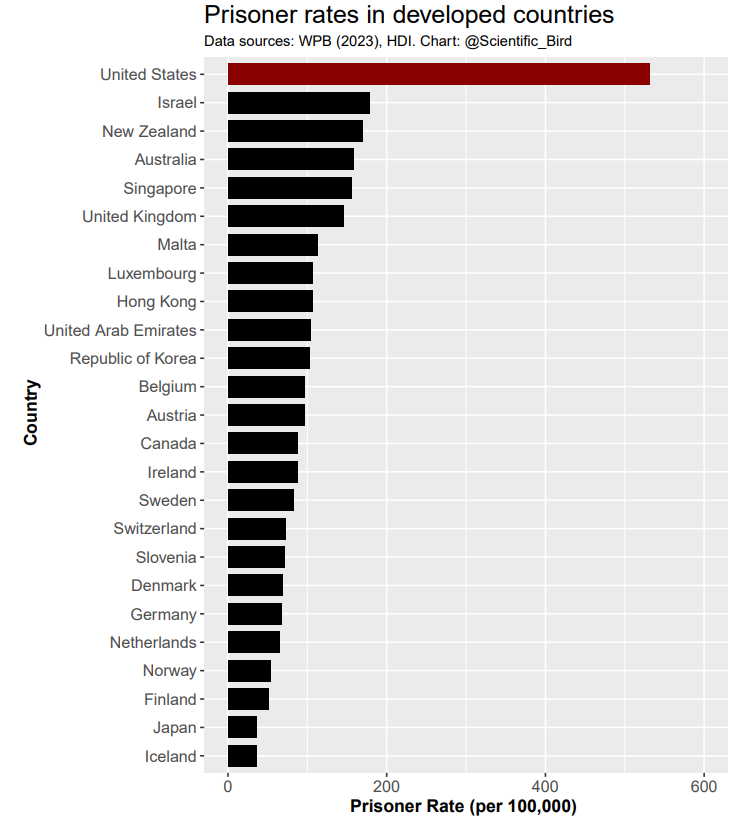
The United States has more prisoners than any other country — the result of being the third largest country in terms of population combined with a very high incarceration rate. According to World Prison Brief (2023), the prisoner rates of the 25 most highly developed countries are:
The United States sits at an estimated 531 prisoners per 100,000 inhabitants. Globally, just four countries have higher prisoner rates: El Salvador (1,086), Cuba (794), Rwanda (637), and Turkmenistan (576).
A natural question is how high the America’s incarceration rate is in comparison with its rate of serious crime. To analyze this, Lewis & Usmani (2022) compared First World countries in terms of their number of prisoners per homicide, instead of the usual prisoners relative to population size. They find that the American prisoner/homicide ratio is about average for the First World, whereas the number of police per homicide is very low. In this sense, when compared to the rate of serious violent crime, the American prisoner rate is unexceptional, but its number of police is exceptionally low.
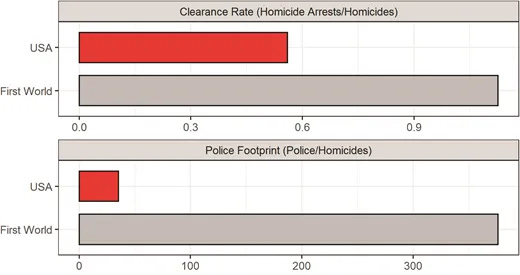
A common misconception is that American high incarceration rate is driven by mass incarceration of drug criminals or other minor offenses. In fact, only a small fraction of prisoners are there for mere drug offenses (see section Prisoners by offense type). The reality is that the high incarceration rate is largely a consequence of the high rate of violent crime in America. Excluding prisoners imprisoned for non-violent crimes, the prisoner rate remains higher than any of the 24 other countries in the above list — if the United States only imprisoned violent criminals, it would still have a higher prisoner rate than the rest of the highly developed world.3
Offenses of criminals
Repeat offenders
Read more about repeat offenders: here.
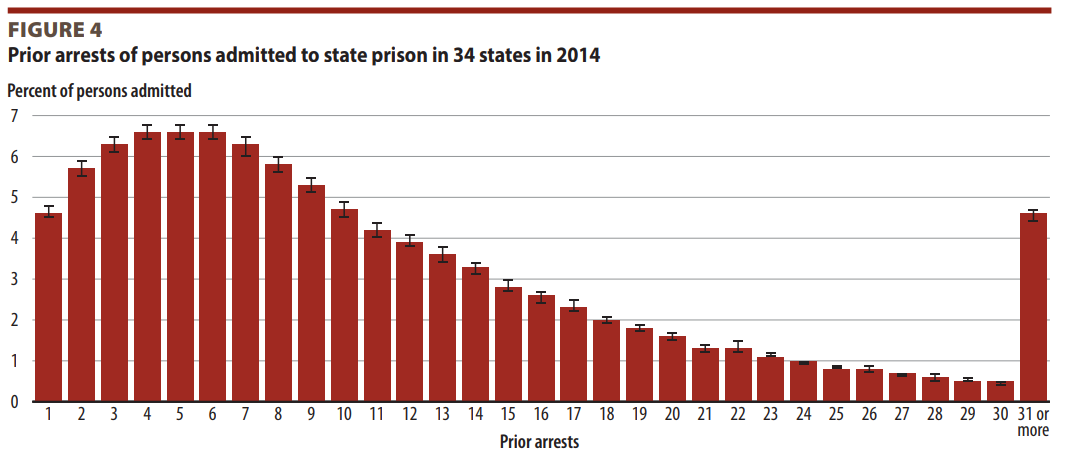
First and foremost, people who are incarcerated are overwhelmingly repeat offenders. As shown below, less than 5% of those admitted to state prison are there as a result of their first arrest (Durose & Antenangeli, 2023). More than 3 out of 4 have been arrested 5 times or more, and the median number of prior arrests for people admitted to state prison was 9.
Recidivism
Following repeat offending, it is natural to also look at recidivism. In general, recidivism rates are high. A 10-year follow-up analysis found that, within the first year of release, 42.9% of released prisoners were rearrested, 24.4% were reconvicted, and 30.7% were reincarcerated (either parole/probation violation or arrest leading to new sentence). Within 10 years, 81.9% had been arrested at least once, 68.8% convicted, and 60.7% reincarcerated (Antenangeli & Durose, 2021).
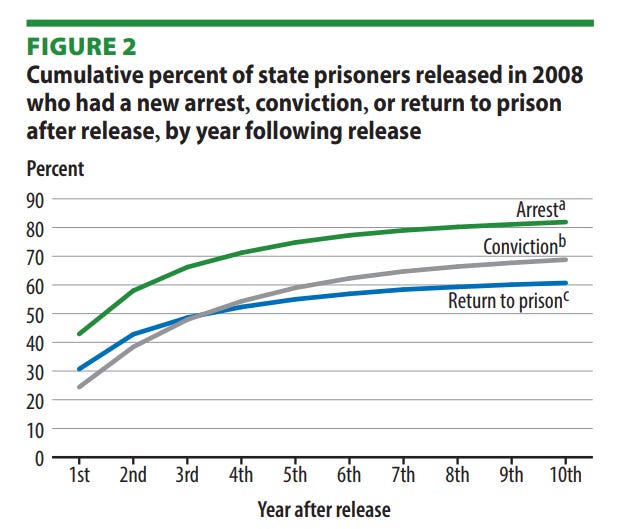
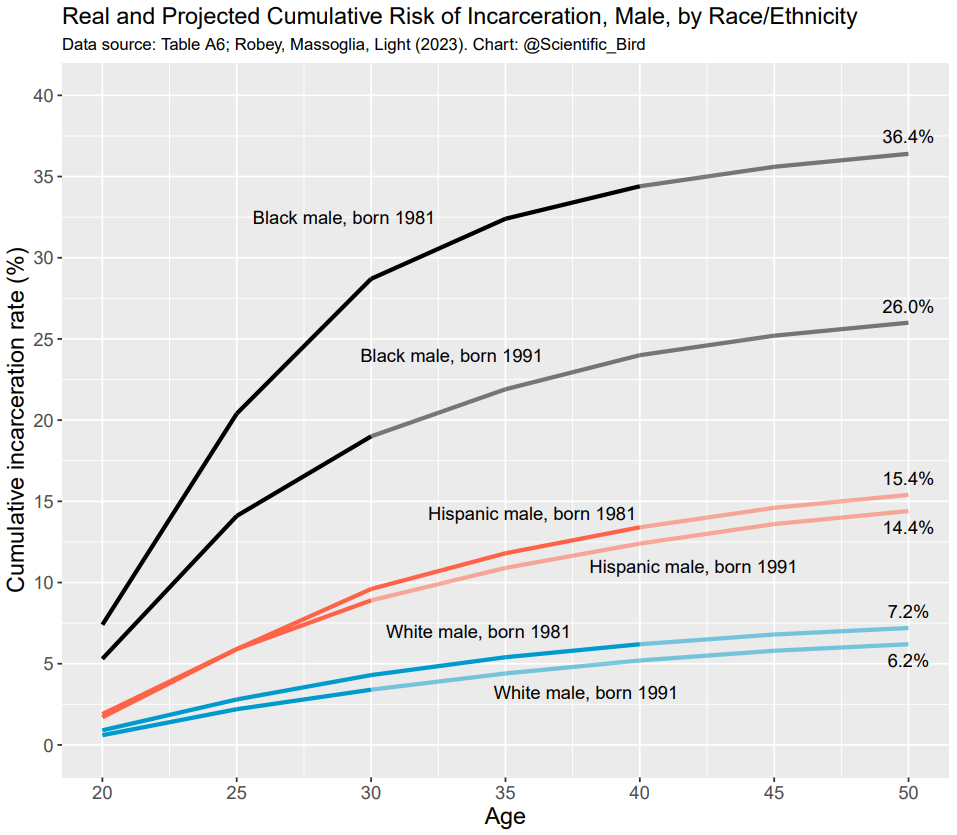
To put the recidivism numbers into perspective, we can compare them with the general population incarceration rates. Antenangeli & Durose (2021) found that 58.7% of imprisoned white people returned to prison within 10 years of release. But for white men in general (born in 1981), the estimated probability of being incarcerated by age 40 was just 6.2% (Table A6; Robey et al., 2023). This is despite the fact that a 40-year-old has been an adult for 22 years, whereas the recidivism follow-up period of 10 years was less than half of that.
Prisoners by offense type
The obvious next question is then: what type of offenses are people incarcerated for? An analysis by BJS statistician Ann Carson (2022) provides details about prisoners in 2021, sentenced to more than 1 year in prison. Below I have illustrated the number of prisoners categorized by their most serious offense.
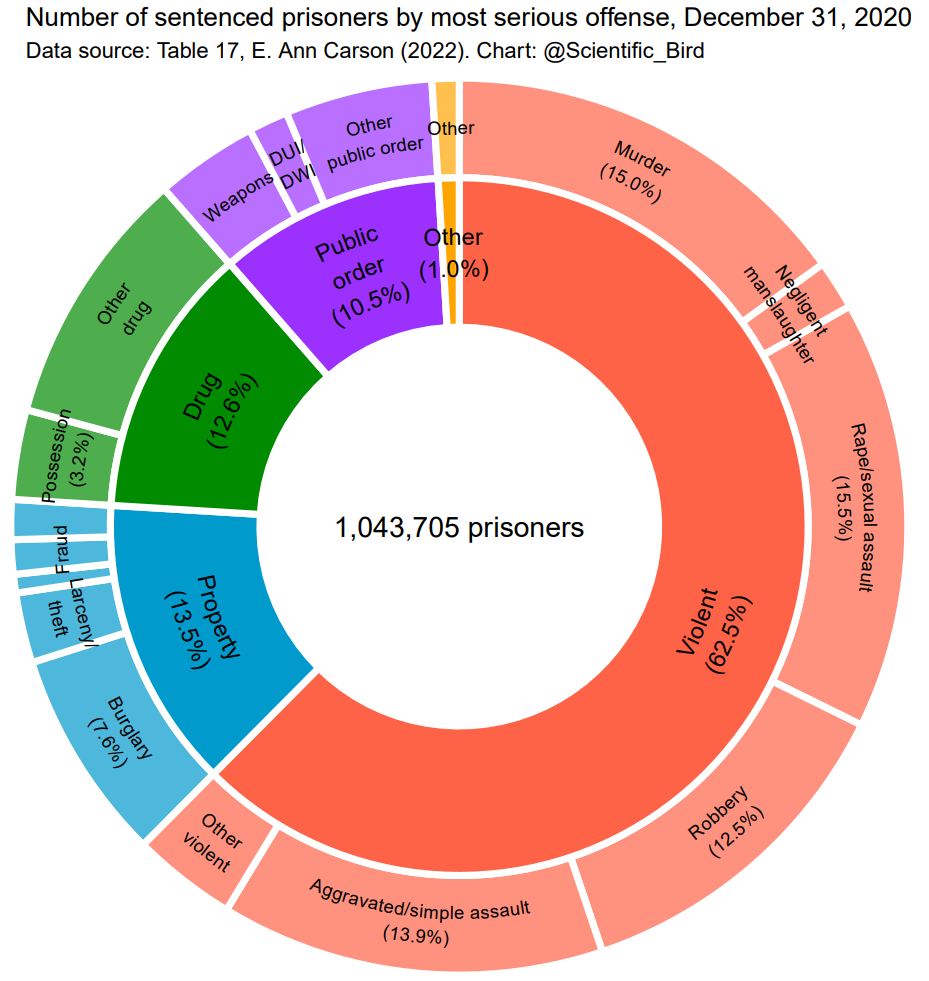
Contrary to popular belief, the high American incarceration rate has little to do with mass imprisonment of drug offenders. About 1 in 8 (13%) were imprisoned for drug offenses and just 3% for drug possession. Recall also that it is rarely an offense that leads to imprisonment, but rather multiple offenses (see section Repeat offenders).
Instead, the high American prisoner rate is primarily driven by the incarceration of violent criminals. The majority of prisoners were imprisoned for a violent crime (62%), and even a substantial 15% for murder (about a quarter of violent crime incarcerations were due to murder).
Demographics of crime
Crime by sex, age and race/ethnicity
Sex, age and race have been referred to as the “big three” correlates of crime in the United States (DeLisi & Vaughn, 2015). The short summary: (a) males commit more violent crime than females, (b) violent crime rates peak between late adolescence and young adulthood, and (c) in terms of race/ethnicity, black people have highest violent crime rates, then Native American, Hispanic, white, and lowest Asian.
Imprisonment by age and race/ethnicity
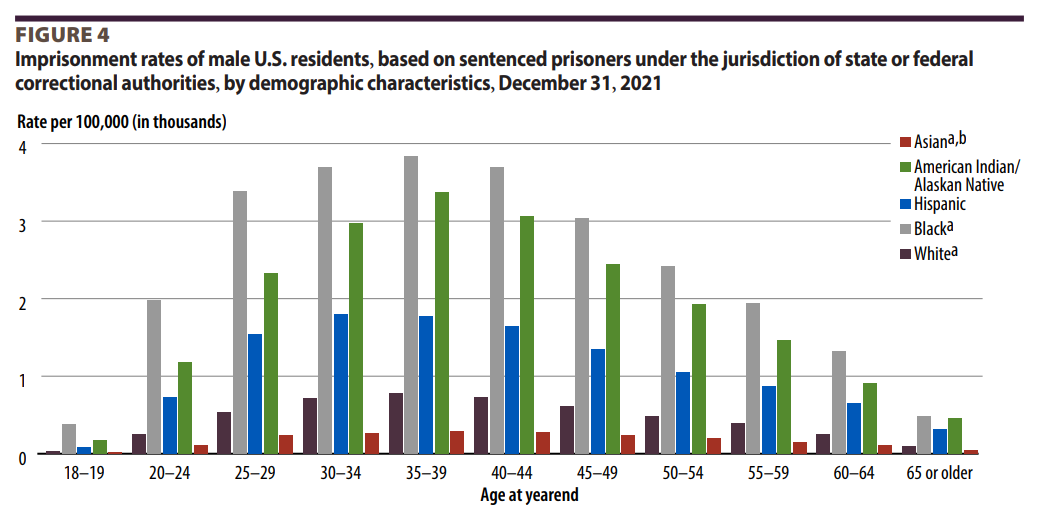
A summary of the demographic breakdown of prisoners in 2021 is as follows: 93.3% of prisoners were male; and in terms of race/ethnicity, 31.4% were white, 33.1% black, 21.7% Hispanic, 1.5% Native American, 1.2% Asian, and the remaining 11.1% other/unknown (Table 17; Ann Carson, 2022). Of course, those numbers should be compared with the general population demographics. In that vein, the following chart displays the male imprisonment rate by age and race/ethnicity (Ann Carson, 2022).
Instead of considering the probability of being incarcerated at any given age, we can also consider the cumulative probability of having been incarcerated by a certain age. That is displayed below.
Homicide victimization by sex, age and race/ethnicity
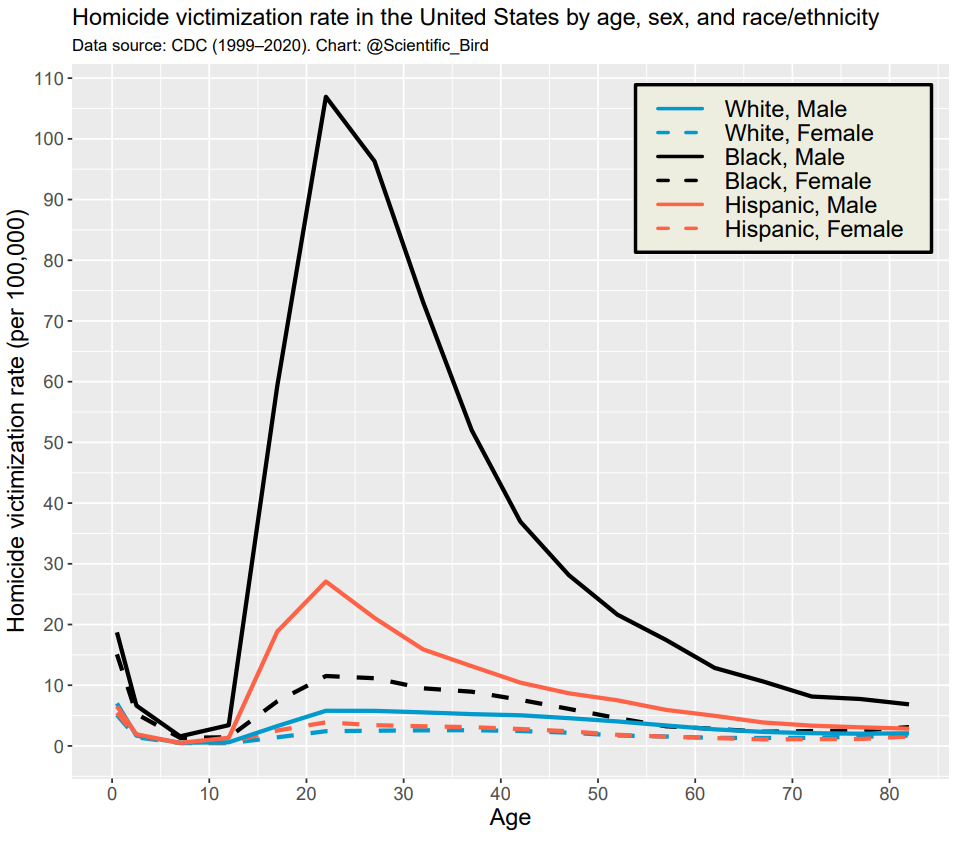
Homicide victimization rates can also give a lot of insight into homicide perpetration rates. Considering first each demographic characteristic individually, we have the following homicide victimization rates in 2021:
Sex: male, 12.7 per 100k; female, 2.9 per 100k.
Age: peak between 20 and 30 years old at around 18 per 100k.
Race/ethnicity: For non-Hispanics: white, 3.1 per 100k; black, 33.9 per 100k; Native American, 12.4 per 100k; Asian, 1.6 per 100k. For Hispanics, 7.0 per 100k.
The following chart displays homicide victimization rates split up by sex, age, the three largest race/ethnicity groups for the years 1999 to 2020.
While victimization rates are strongly related to offending rates, there is some spillover from high- to low-perpetration rate groups. This means that the female victimization rate is higher than their offending rate, the black victimization rate is lower than their offending rate, the white victimization rate is slightly higher than their offending rate, etc.
Interracial crime
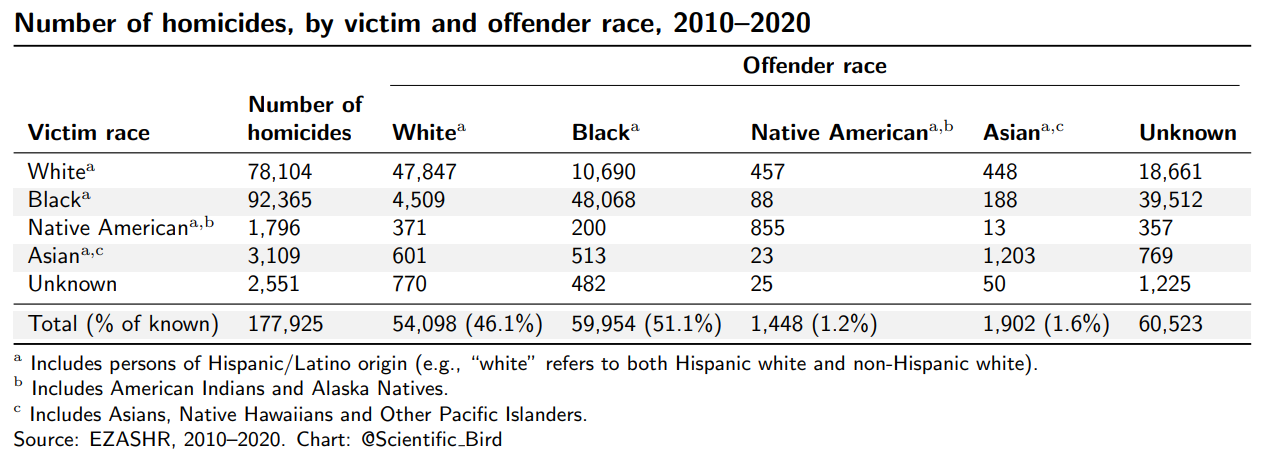
To illustrate how often criminal incidents involve members of different demographic groups, we consider interracial crime next.
The following table displays the number of homicides by victim and offender race between 2010–2020. I have used EZASHR for easy access to cross-tabulations, which draws from FBI homicide data. There is also data for non-fatal interracial violent crime derived from survey estimates, though I focus here on the more reliable homicide statistics.
Between 2010 and 2020, of homicides with known race of offender and victim:
80.5% of white victims were killed by a white person; 89.7% of white perpetrators had white victim.
90.9% of black victims were killed by a black person; 80.2% of black perpetrators had a black victim.
59.4% of Native American victims were killed by a Native American; 60.1% of Native American perpetrators had a Native American victim.
51.4% of Asian victims were killed by an Asian; 65.0% of Asian perpetrators had an Asian victim.
The short summary is that most homicides are intraracial (victim and offender are of same race), though with some amount of spillover from groups with higher perpetration rates to those with lower perpetration rates. For example, there are a little more than twice as many black-on-white homicides as there are white-on-black.4
Geography of Crime
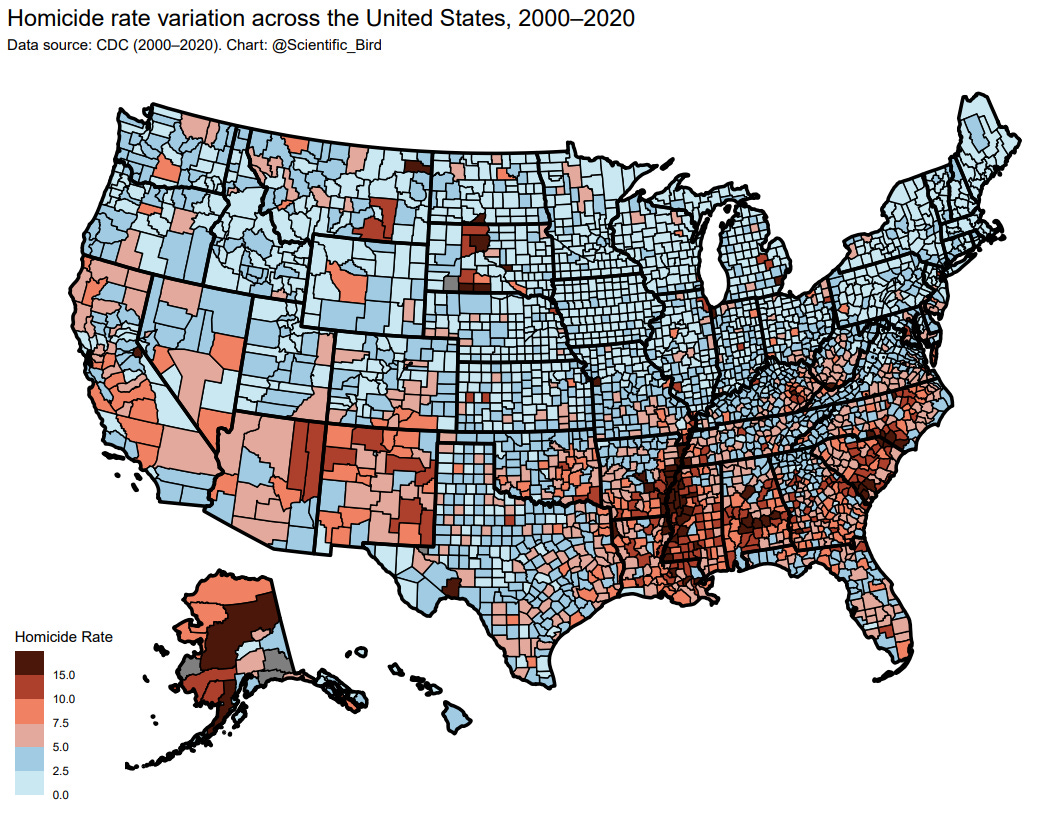
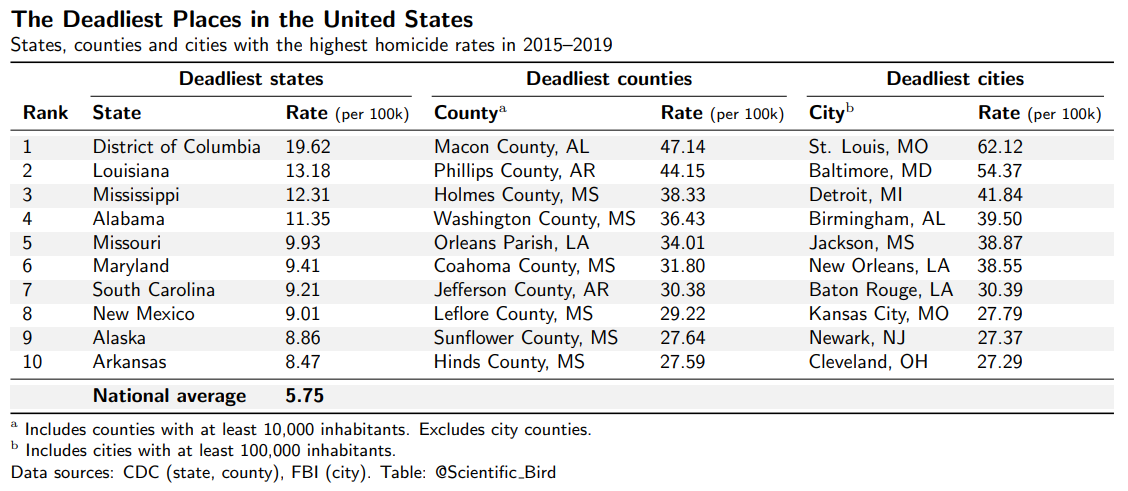
While the United States has a high national violent crime rate, there is great regional variation. Between 2015 and 2019, the American homicide rate was 5.75 homicides per 100,000 inhabitants. But the safest state of Maine had a rate of just 1.50, not too unlike that of West Europe.
To illustrate the regional variation, the following chart displays the homicide rates for 3,000+ counties across the United States. Homicide rates were aggregated between 2000 and 2020 to reduce year-to-year variation noise, particularly in low-population counties where few homicides happen in a single year.
There are some clear trends. High homicide rates are clustered in belts towards the Southeast and, to a lesser extent, to the Southwest. The few counties with high rates in the North are areas with high fraction of Native Americans, many with Native American reservations.
Which places are the most dangerous? The following table lists the 10 deadliest states, counties and cities in terms of homicide rate.5
The city with most total murders is Chicago, though outside the above list, having the 15th highest murder rate among cities with at least 100,000 inhabitants. The cities of St. Louis, Baltimore and Detroit top the list with astonishing homicide rates exceeding 40 per 100,000. This is not just high by American standards, these cities are among the most murderous cities in the world.
Which cities then are the safest? If we narrow it down to the very large cities with 750,000 inhabitants or more, then there were just 5 cities with homicide rates substantially lower than the national average of 5.75: Honolulu (2.33), San Diego (2.91), Austin (3.13), San Jose (3.25), and New York City (3.74).
Circumstances of Homicides
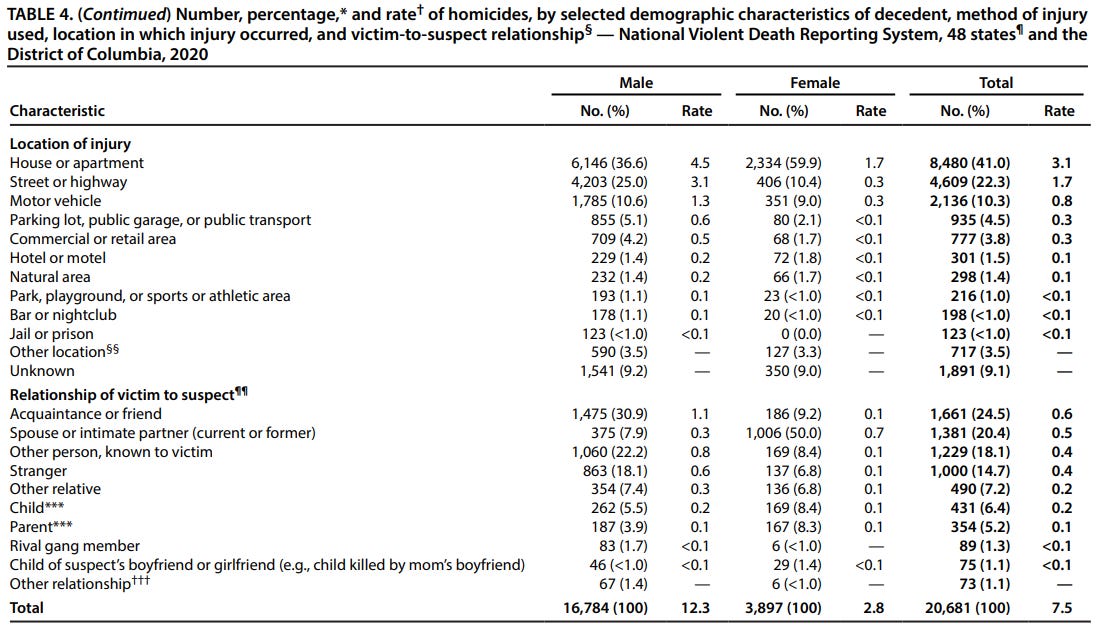
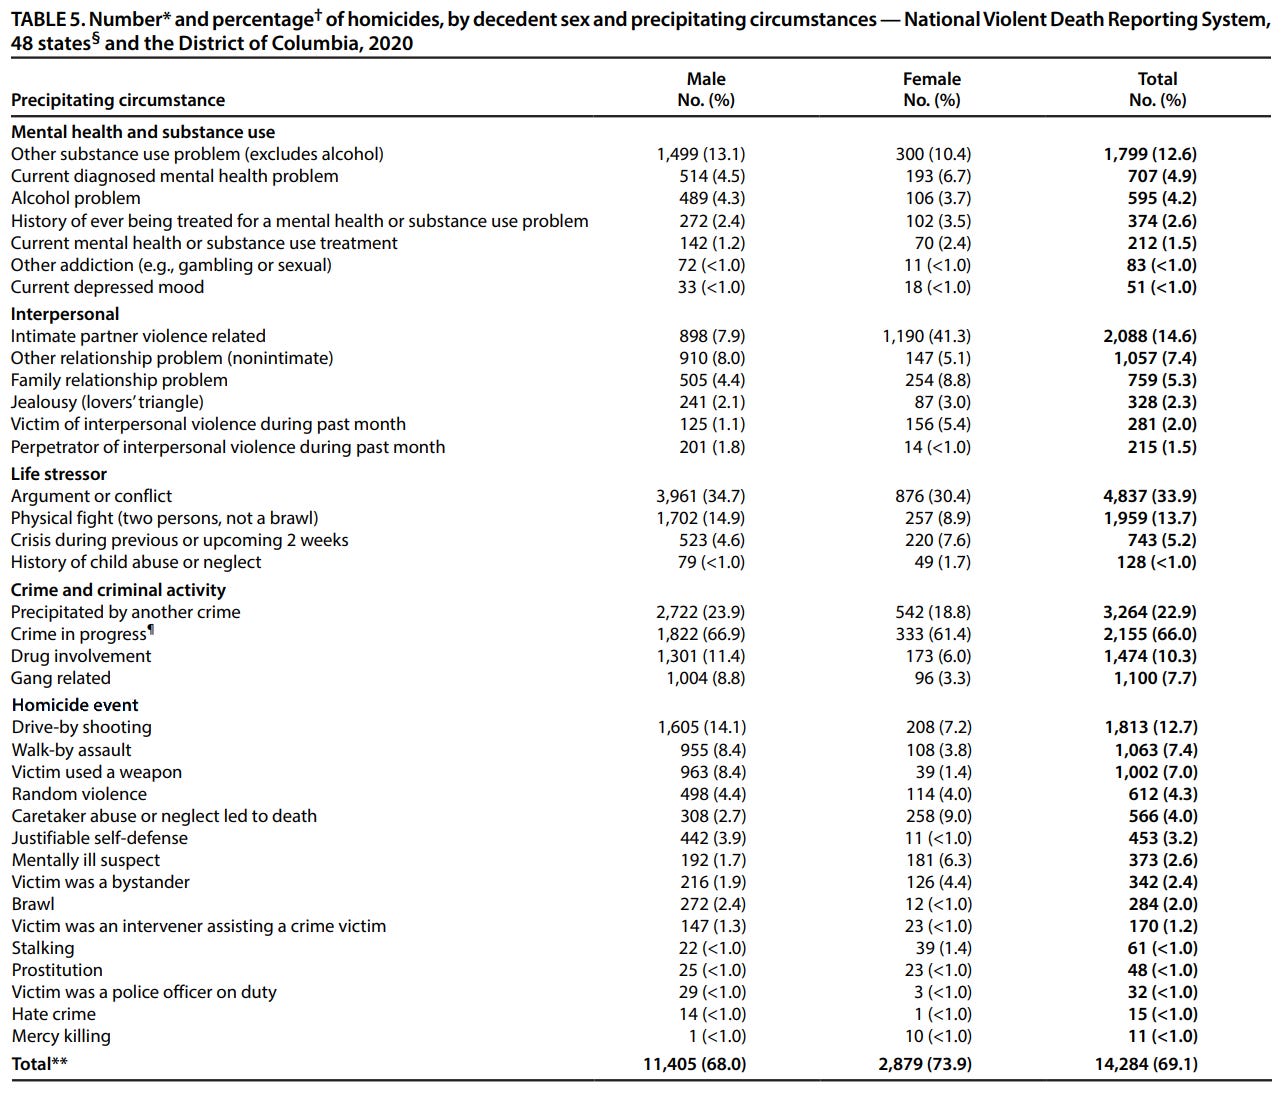
Liu et al. (2023) summarize various details about homicides in the United States. Among other things, in it they analyze the victim-to-suspect relationships and the circumstances of the homicide. The findings are summarized in the tables below, and then I will briefly discuss some of the notable findings.
Method of injury
By far the most common weapon was a firearm, used in 76.7% of homicides. This was followed by a sharp instrument (9.1%), a blunt instrument (3.3%), and “personal weapon” (e.g., a fist or foot; 2.5%).
Criminal activity
Many homicides were precipitated by another crime (22.9%), and the crime was in progress in 66.0% of those cases. The most common precipitated crimes were assault/homicide (38.9%), robbery (32.9%), drug trade (14.5%), burglary (10.8%), and motor vehicle theft (5.0%).
The proportion of homicides that were gang related was just 7.7%. Further, in just 1.3% of homicides were victim and and suspect rival gang members. In total this seems to suggest that the typical homicide has less to do with gang crime than it does with everyday individual crimes (e.g., robbery or assault).
Conflicts
A significant number of homicides were precipitated by argument or conflict (33.9%) and physical fight (13.7%).
Intimate partner violence
The fraction of murder victims that is due to intimate partner violence is predictably higher for women than men. For 41% of female murder victims it is related to intimate partner violence, and 50% of female murder victims are killed by current or former spouse or intimate partner. The victim being killed in their own home is also more common for women (60%, vs 37% for men).
Alcohol and other substances
A sizeable minority of murders involve alcohol problems (4.2%) and/or other substance abuse problems (12.6%). The proportion that contains any of them is thus between 12.6% and 16.8% (presumably there is some overlap, some incidents containing both).
Of the homicide victims that were tested, 36.4% of blood tests were positive for alcohol (Table S7). When tested, victims often tested positive for other drugs such as cannabis, amphetamines, opioids, and cocaine. Other research has also found that 40-50% of homicide victims test positive for alcohol (Kuhns et al., 2011; Naimi et al., 2016), and similarly for homicide offenders (Kuhns et al., 2014).
Conclusion
Here I have tried to give a brief overview of crime in America. The purpose was to lay out a body of general information and not focus on any one particular question or aspect of it, though a few common questions were answered in the process. For example, the high American incarceration rate is mainly the result of the nation’s high violent crime rate and certainly not, as sometimes suggested, the result of mass incarceration of petty drug offenses.
There is a natural follow-up question to everything I have written in here: why is the violent crime rate so high in the United States in the first place? This is an interesting question, one I might tackle in the future, though it is the kind of question that requires more thorough analysis than I intended to include in this post. As for other questions concerning crime in America, hopefully the information in here can be of some use.
The data is based on vital statistics which track deaths and their causes, including homicide deaths. Today this is tracked by the CDC. As vital statistics did not capture the full population until 1933, estimates by Eckberg (1995) are used instead for years prior.
The 25 most highly developed countries according to the Human Development Index (HDI) report of 2022. National homicide rates are from UNODC victims of intentional homicide.
In 2021, there were 1,185,700 prisoners in the United States sentenced to at least 1 year of prison, equivalent to 360 per 100,000 U.S. residents (Ann Carson, 2022). If we take only those who had been sentenced for a violent crime (651,800), the rate is 198 per 100,000. This exceeds the prisoner rate (for any crime, of any length) of all the other top 25 most developed countries. The implication is that, even if we only include criminals sentenced to at least 1 year in prison and only those sentenced for a violent crime, the United States still has a prisoner rate that is higher than all the other most highly developed nations. This illustrates how the high prisoner rate in the United States cannot be understood as a phenomenon of mass incarceration of drug offenders, and instead must be considered in light of the high American violent crime rate.
In short, the American incarceration rate can probably best be understood as follows: only the richest nations on the planet can afford to diligently enforce the law, and America is unique among the richest nations in its high violent crime rate. In poorer countries, incarceration rates are often low relative to the crime rates due to a lack of enforcement. For example, Nigeria ranks as having one of the lowest prisoner rates in the world (36 per 100k), despite having one of the highest homicide rates.
This is why the fraction of black victims that were killed by a black perpetrator is higher than the fraction of black perpetrators that have a black victim, whereas the opposite is the case for whites and Asians. However, it is probably also partly due to the lower clearance rate for black victims (i.e., black offenders are disproportionately represented among the unknown offenders).
Note that the observed difference is not because there are more white people than black people. Interracial incidents involve members of each group and are symmetric: when one white person encounters a black person, a black person encounters a white person. Therefore, it is correct to compare raw counts and one should not control for population group size of either group.
Homicide rates by state and county are retrieved from the CDC, and the rates by city are calculated from FBI data. I collected the known homicides for all cities in each state for the years 2015, 2016, 2017, 2018, and 2019. Rates are easily calculated by dividing homicide counts with population size.


Super informative. Thank you!
This is a great article, but you need to dedicate more time to racial differential in homicide rates. In particular, if US black and Latino murder rates were the same as US white murder rates, then the United States would have similar murder rates as our economic peer nations, even though whites own more guns per capita than black folks or Latinos.
https://hwfo.substack.com/p/real-talk-about-race-and-murder-rates