
Cohort fertility projections
Addressing the lag in cohort fertility data

Introduction
A society’s fertility level can be measured in different ways. By far the most commonly used measure is the “total fertility rate.” To calculate it for a given year, you take the number of births by women in an age group divided by the total number of women in the same age group.1 These ratios are added up for all individual childbearing years (convention being 15 to 49 years old):
The measure attempts to “simulate” the number of children a woman will have over the course of all her childbearing years. A fertility rate of just over 2 children per woman is the level at which a population is sustained.
A different measure is the “completed cohort fertility rate.” Instead of adding up births in a given year, you follow all women born in a given year (a cohort) and track how many children they have had by the end of their childbearing age.
A major strength of TFR as a measure is its convenience. Being a period measure, it requires only data from the given year to calculate. Such period data is much more commonly available than cohort data (which requires tracking people for decades). Based on period data, some countries have fertility time series available for multiple centuries. Many countries do not have any cohort data.
The difference between the total fertility rate (TFR) and the completed cohort fertility rate (CCFR) is well-illustrated by Our World in Data:
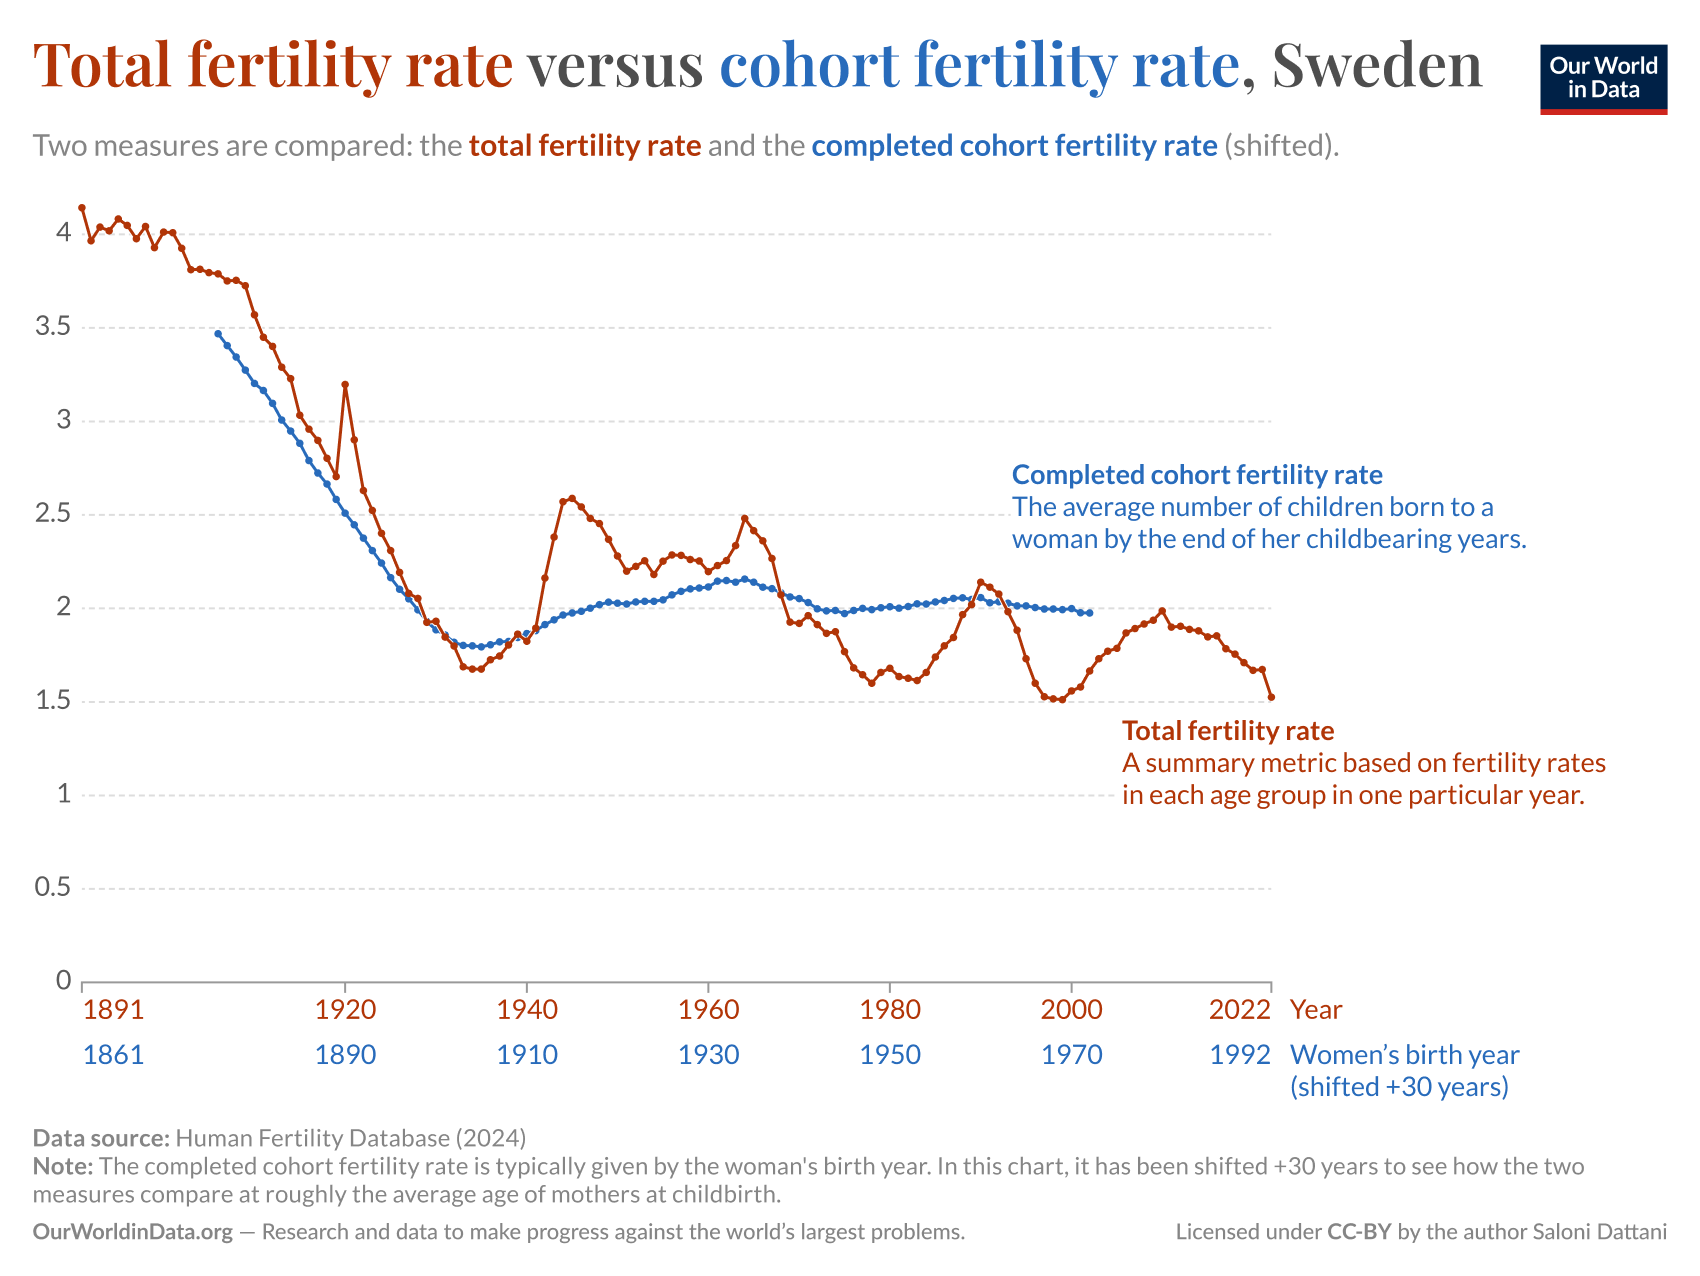
In the figure, we see that the total fertility rate in a given year (say, 1990) approximately coincides with the cohort fertility of women born 30 years earlier (in 1960). However, the large fluctuations in total fertility rate between 1970 and 2010 are mainly artifacts of so-called “tempo” effects. That is, trends in birth timings rather than the actual number of children women have over their lifetime.2
In truth, Sweden’s underlying fertility was much more stable than the total fertility rate suggested. Motivated by this problem, a period measure that attempts to correct for tempo effects has also been developed (Bongaarts & Feeney, 1998).
Completed cohort fertility (unlike the TFR) is a “true” fertility measure in the sense that it actually tracks how many children women have over their lifetime. It isn’t affected by the push and pull of birth timings, and being not subject to tempo effects, it is much more stable—and arguably more suited for revealing underlying long-term trends.
There is, however, one major weakness of the completed cohort fertility measure: it is always out-of-date. As of 2025, women born in 1980 still haven’t fully passed their childbearing years. This cohort’s completed fertility value is therefore only available after they pass a certain age (a typical cut-off might be 50).
In this post, I partially address this issue. I present a simple method for projecting completed cohort fertility a number of years forward (up to ~15 years). The results of 33 countries will be made available for download.
While these projections are still not fully up-to-date to period measures, they lag substantially less behind than the conventional cohort fertility measure.
Forecasting completed cohort fertility
For the sake of illustration, I will consider the 1985 cohort in Sweden. These women are now about 40 years old—their childbearing years are largely but not entirely over.
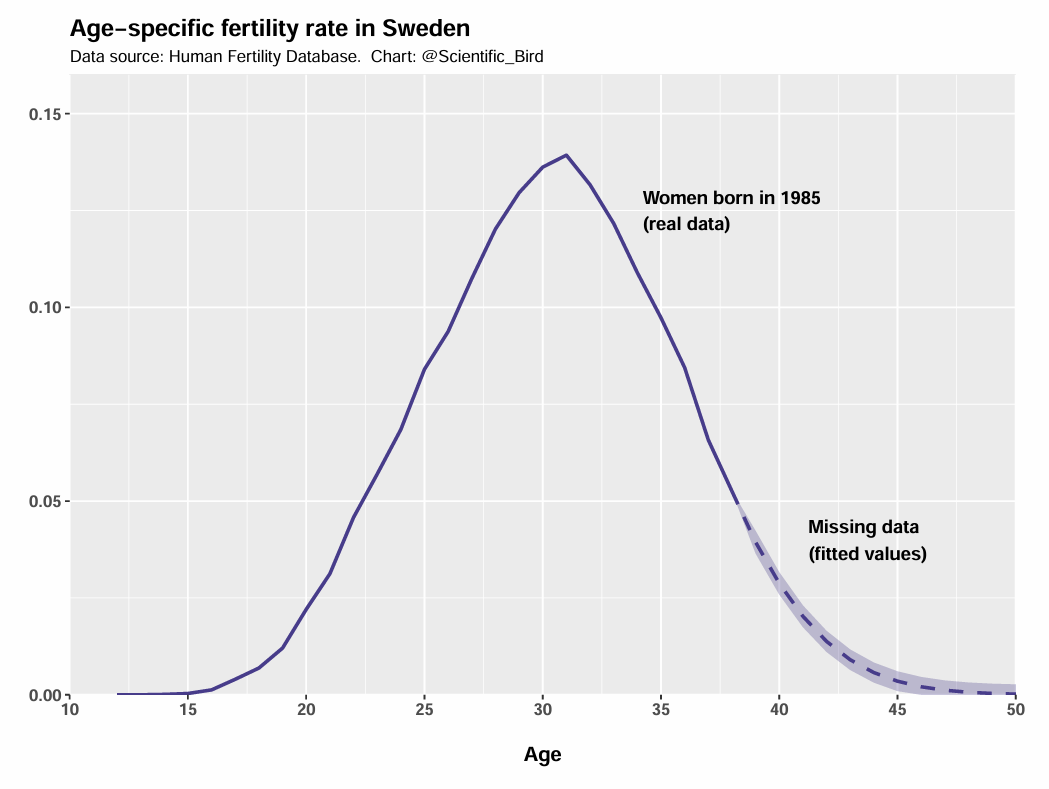
I start off by considering this cohort’s age-specific fertility rates. In the data I use, age-specific fertility rates are available up to age 38.
Age-specific fertility rates are often modeled by scaled normal distributions or a mixture of scaled normal distributions (Peristera & Kostaki, 2007). The age-specific fertility rate (ASFR) in the right tail can thus be approximated as:
where a, b, and c are parameters to be estimated. I estimate the missing age-specific fertility rates by finding the curve that best fits for the ages beyond peak fertility age (the shape of the curve to the the left of the peak is not relevant, as data is not missing there).
The sum of these age-specific fertility values provide the total fertility attained over this cohort’s childbearing years. This is shown accumulated by age below.
In the real observed data, the woman had 1.72 children on average by age 38. The projected value for completed cohort fertility is only modestly higher at 1.85 children per woman. That’s not surprising—women typically do not have many children after the age of 38.
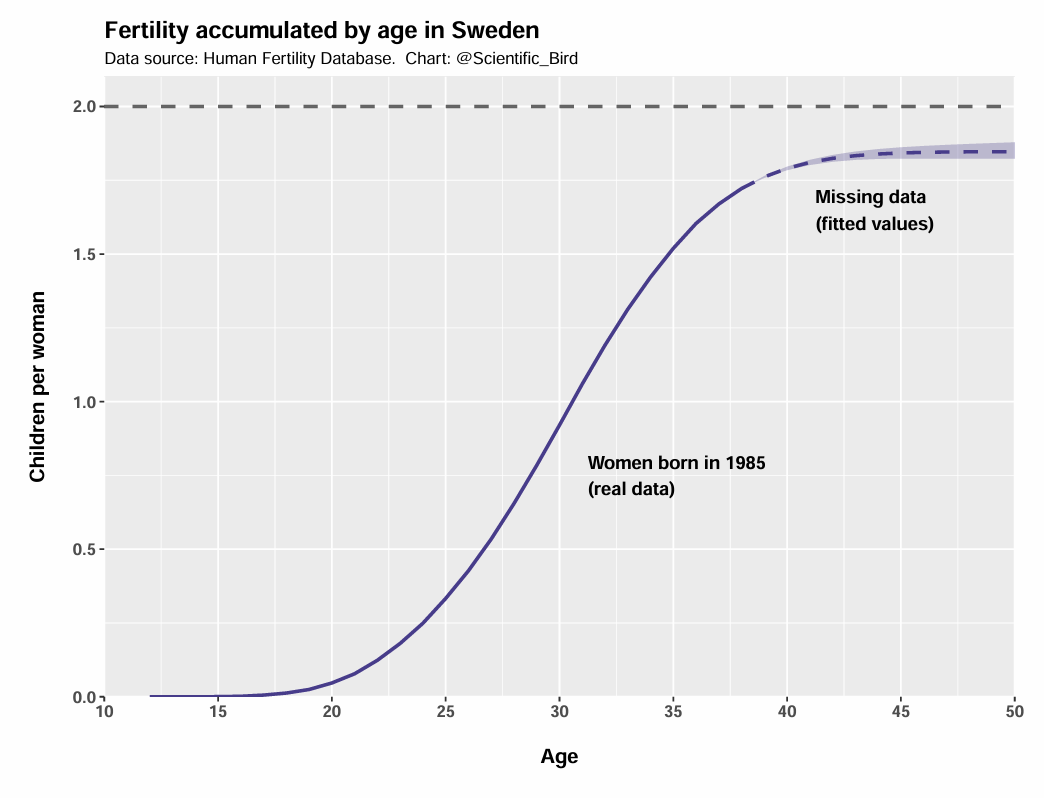
And thus the 1985 cohort’s fertility has been forecasted: 1.85 children per woman. These steps can then be repeated for other cohorts.
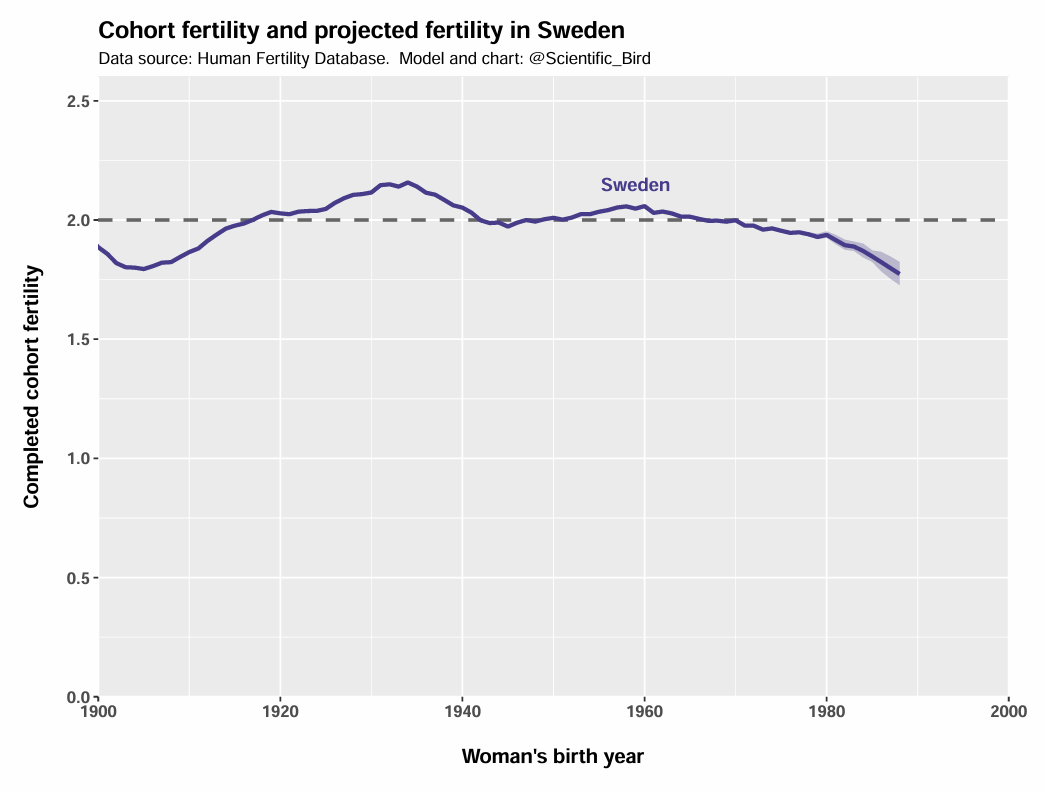
This is what I’ve done for Swedish data in the chart below. It illustrates the true cohort fertility for older cohorts, and projected fertility for cohorts with incomplete data. Specifically, 1973 is the latest cohort for which there is full data. These projections extend 15 additional years to the 1988 cohort. As seen in the chart, the Swedish cohort fertility is expected to drop modestly between the 1973 and 1988 cohorts.
Results
The methodology described above has been repeated for 33 countries’ worth of data. The results can be downloaded below. The data used for the projections is supplied by the Human Fertility Database.3
Updates:
May 30, 2025: slight improvements to the stability and prediction interval calculation. The relevant changes are to the prediction intervals. Changes to the point estimates are negligible.
The time series are of varying length and quality, and some are more up-to-date than others. All this depends on the data that the HFD have access to and have supplied.
Below I will briefly discuss the results of three nation groups: the Nordics, East Asian and Southern Europe. I’ve put figures for some additional country groups in the appendix. The results of all countries can be accessed in the file.
Nordic fertility
Apart from Iceland, the Nordic countries have historically had fairly stable cohort fertility rates, mostly hovering in the 1.8-2.1 range for several decades. These forecasts suggest that cohort fertility will gradually decline between the 1975 and 1989 cohorts.
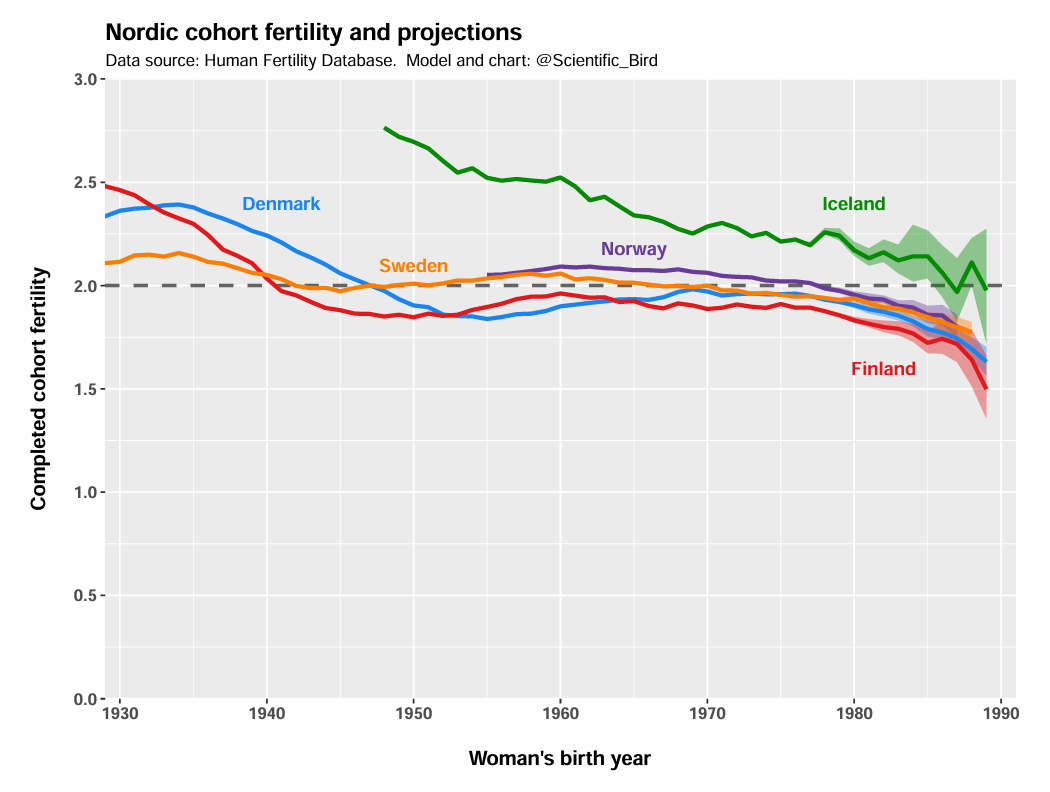
Denmark, Sweden and Norway all follow very similar trajectories and the 1987-1989 cohorts are expected to have fertility rates of about 1.7-1.8. Finland appears to have the lowest fertility with a more dramatic decline in the latest cohorts, but it is also estimated with a fair bit of uncertainty.
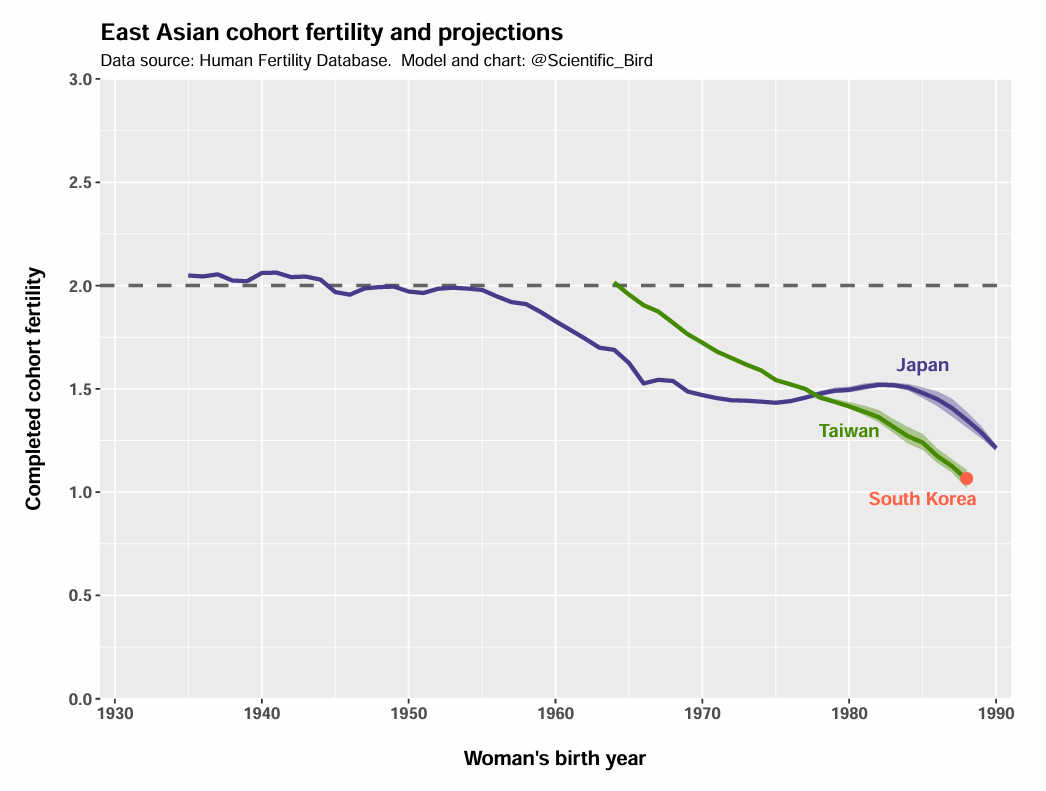
East Asian fertility
East Asia is the region with the lowest fertility, and this remains true for completed cohort fertility. Using HFD data, I could construct time series for Taiwan and Japan. For the criteria I used, there was only a single cohort (1988) with adequate data to generate an estimate for South Korea.
For both Japan and Taiwan, the trend is clearly indicating decreasing fertility for more recent cohorts. The decline is quite rapid (compared to, say, the Nordics). The projections suggest that the most recent cohorts will have lifetime fertility of less than 1.25 per woman. For Taiwan and South Korea, the estimate is only about 1.06.
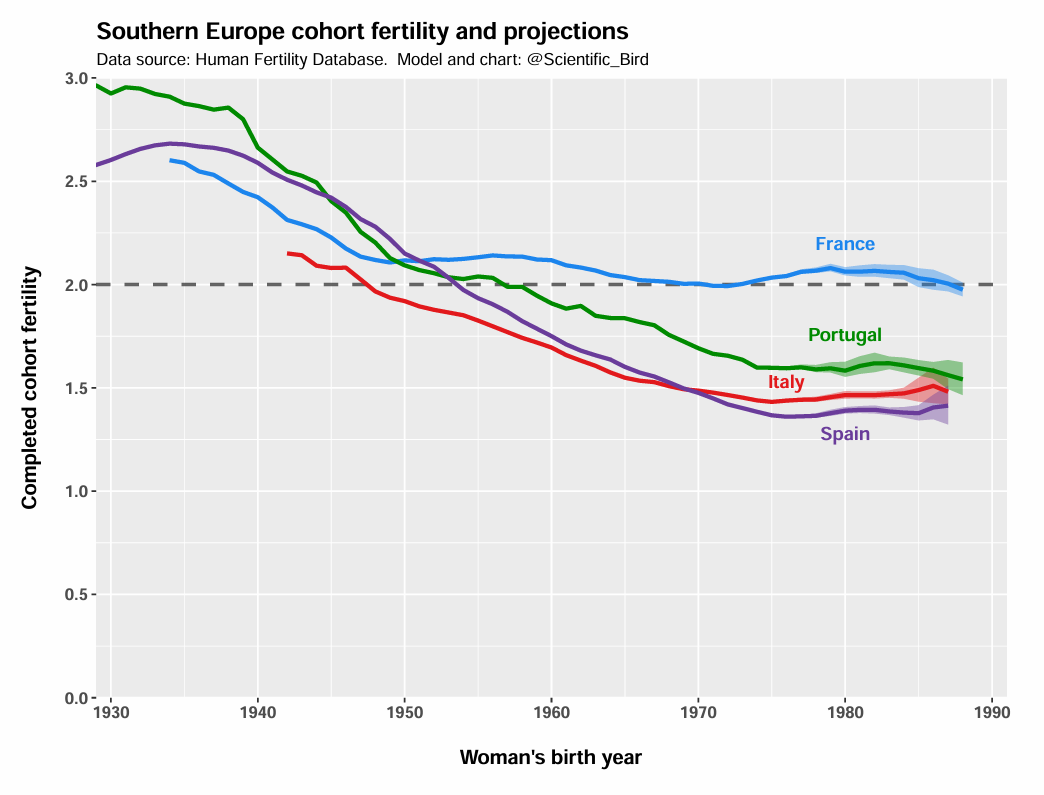
South European fertility
South European countries like Italy and Spain have had very low total fertility rates for a while, not unlike East Asian countries. This is also reflected in their low completed cohort fertility rates.
However, the projections suggest that South European fertility is stabilizing for many cohorts around 1.4-1.5. And while this is a low level, these countries do not appear to experience the same continued decline as the East Asian countries mentioned above.
France is included here just for completion’s sake. But it should be noted that France is very unlike Spain, Italy and Portugal with respect to fertility. In fact, France is notable for having one of the higher fertility rates in Western Europe.
Conclusion
In this post, I’ve constructed estimates of completed cohort fertility for cohorts with incomplete data. There are estimates for 33 countries, and the results are available for download.
Using these projection estimates, completed cohort fertility lags much less behind period fertility measures than the typical cohort measure. How much does it lag behind? Several countries have estimates for cohorts as recent as 1988-1990.
While this sounds old, keep in mind that cohort fertility is roughly equivalent to period fertility 30 years later (i.e., in 2018-2020), and that cohort fertility is better suited for capturing underlying trends.
With more up-to-date data, discussions about the causes of fertility trends can hopefully be more fruitful. To understand a phenomenon, it is usually best to start with a solid foundation of descriptive data.
Appendix
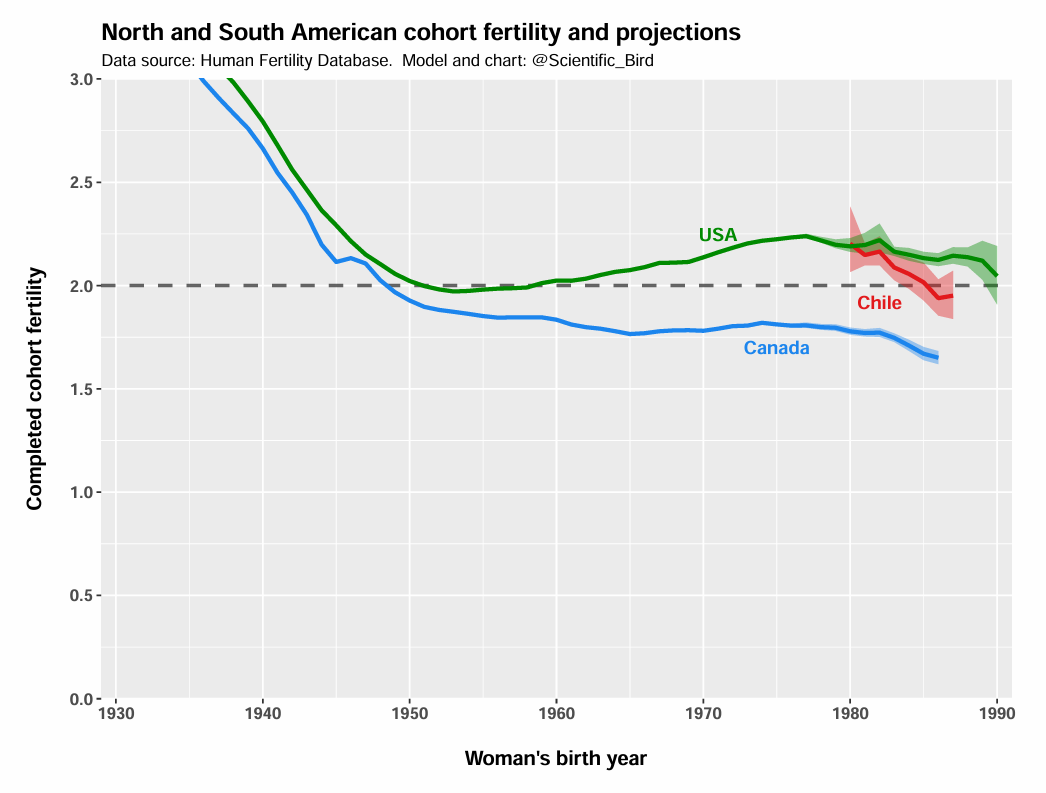
North and South American fertility
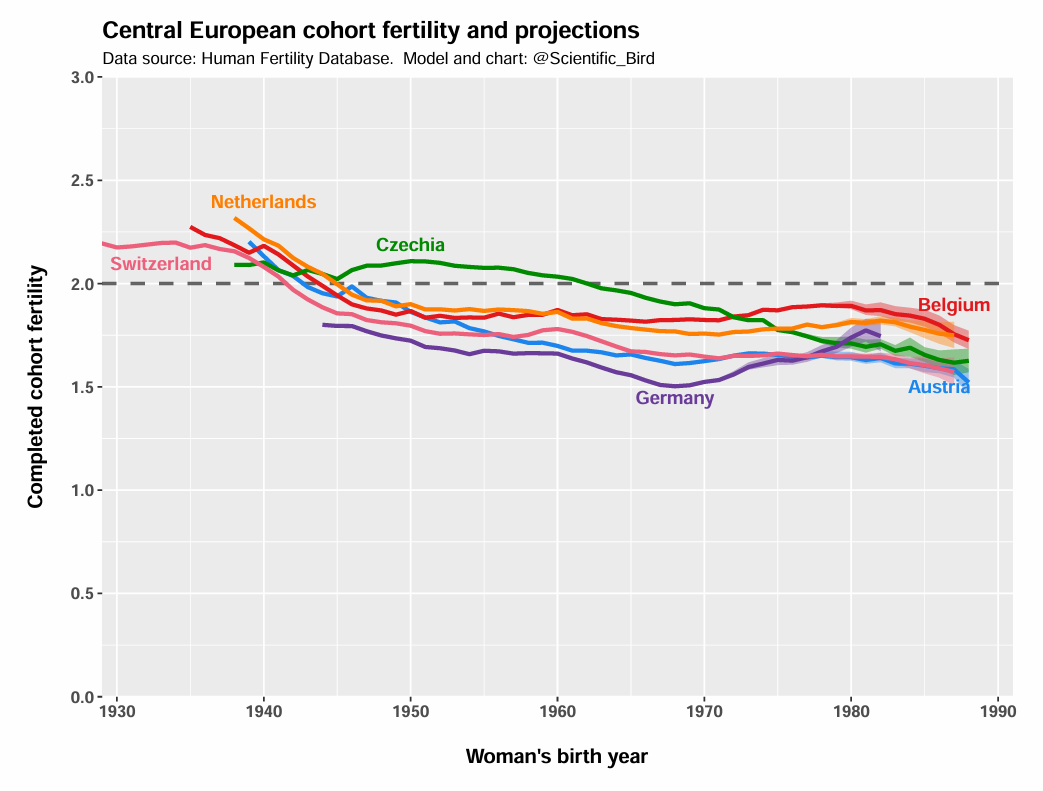
Central European fertility
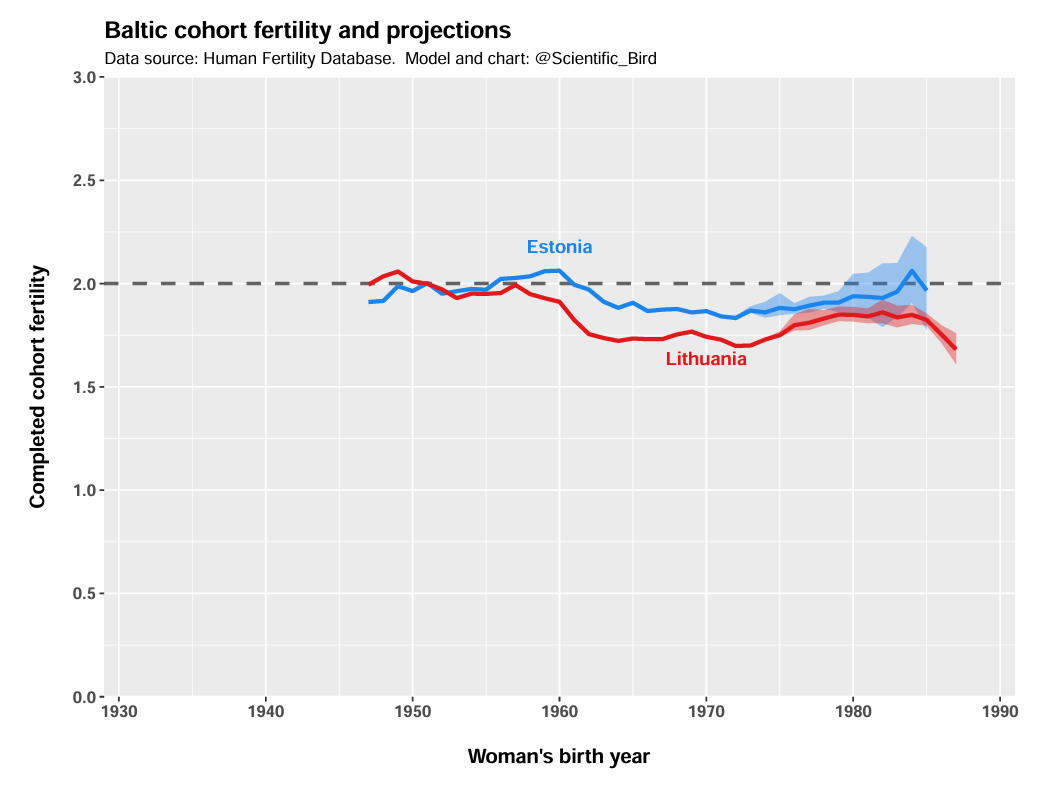
Baltic fertility
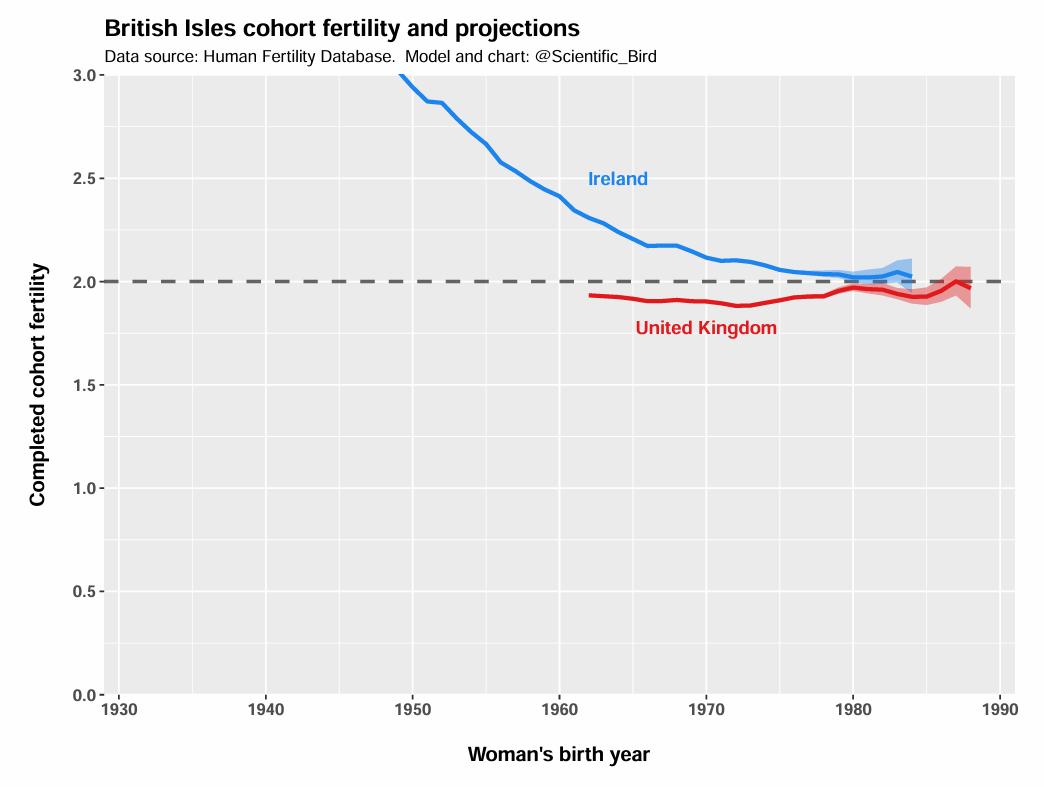
British Isles fertility
Sometimes individual-year ages aren’t used, but instead 5-year age groups. In practice, this makes very little difference for the estimation of TFR. In such cases, the TFR is calculated as
To understand how birth timings can affect the total fertility rate, suppose that two birth cohorts of 1988 and 1990 have identical fertility, except that the 1988 cohort delays parenthood by two additional years. Roughly 30 years later, when the birth cohorts reach their age of peak fertility, 2020 is experiencing two cohorts’ worth of peak fertility. In this example, 2020’s total fertility rate would be an overestimate of the society’s underlying fertility level. The opposite effect would occur if the 1990 cohort had delayed parenthood compared to the 1988 cohort.
Specifically, the period age-specific fertility rates by cohort have been used to construct the estimates. I.e., “Birth counts, population exposures, and rates: period” > “Age-specific fertility rates” > “All birth orders combined” > “year, cohort”
You have not read https://www.pnas.org/doi/10.1073/pnas.1722364115 ???
Why not backtest the method on older cohort data? Presumably you can find the age specific fertility rates for some countries for the past and compare to the cohort fertility rate.